
Solana price holds below $149 as breakout attempts fade

The Solana price today is trading near $147.5, bouncing off short-term support after dipping below $144.50 earlier in the session. The rebound, sparked by a bullish engulfing candle on low timeframes, briefly pushed the token above its 20 and 50 EMA lines. However, upward momentum was once again capped near $149—a key resistance zone that also rejected price action on May 7.
This $149–$150 area has emerged as the ceiling of a tightening consolidation pattern, suggesting market indecision as buyers struggle to maintain momentum. On the daily chart, Solana continues to hold above its 200-day EMA at $140.89, preserving a broader bullish bias. But for the uptrend to reassert itself, bulls must clear the 23.6% Fibonacci retracement at $155.43, drawn from the November 2023 peak to the March 2024 low.
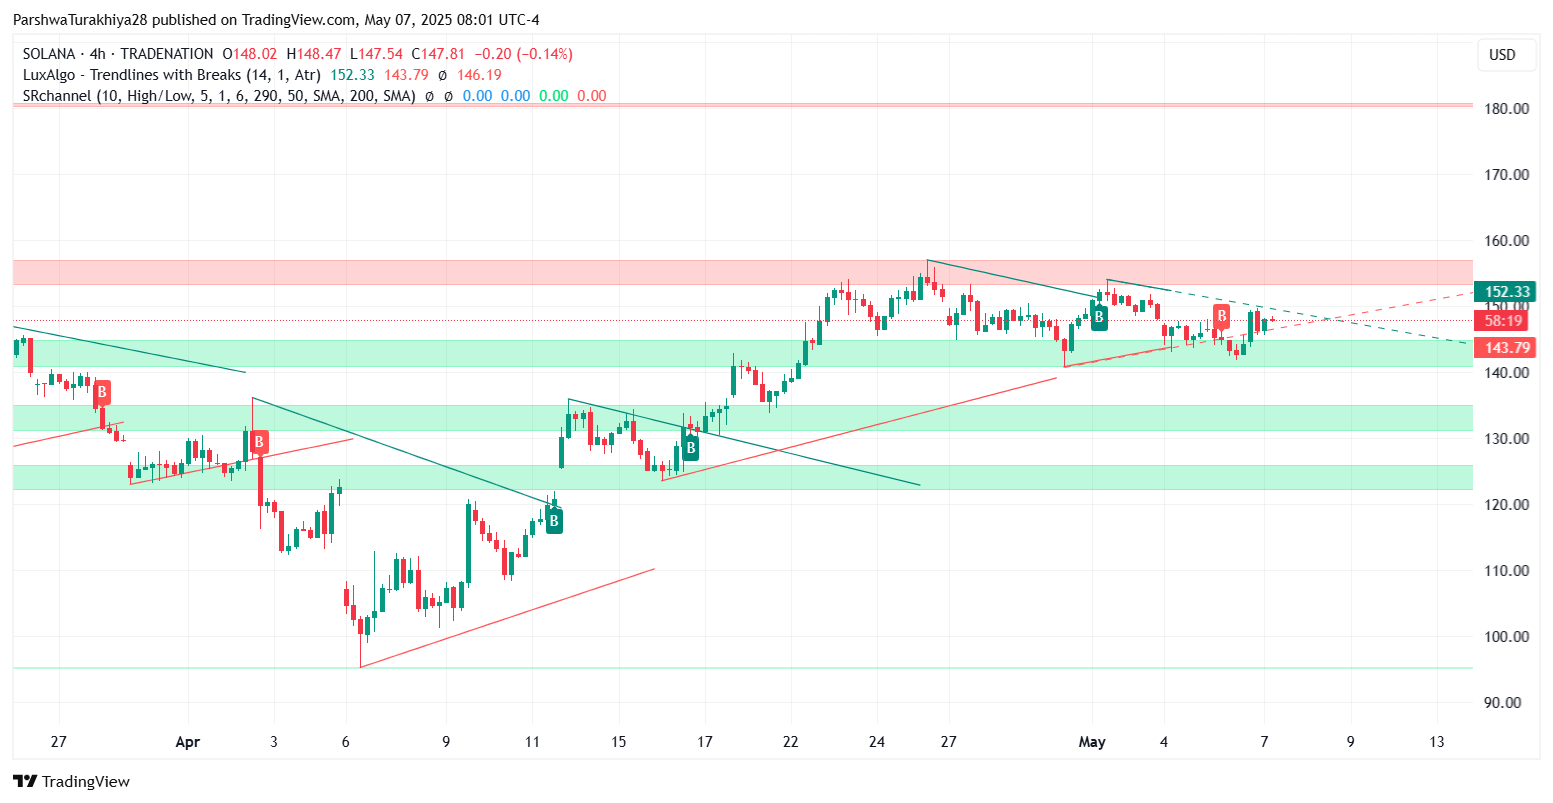
Solana price dynamics (March 2025 - May 2025) Source: TradingView.
Why Solana price going down today: Profit-taking and resistance rejection
Intraday indicators show clear signs of exhaustion following an earlier bounce from $141.65. The rally had been supported by a trendline retest and bullish divergence on RSI. But rejection at $149.28—a zone marked by previous supply and trendline resistance—triggered profit-taking and a loss of upward traction.
On the 15-minute chart, the RSI dropped to near 40 after peaking above 70 on May 7, while MACD lines crossed bearishly with a fading histogram. The 4-hour chart adds weight to the caution, with Stochastic RSI turning lower from overbought levels and price pulling back from upper trendline resistance.
Solana price forecast: Key levels and volatility zones ahead of May 9
Solana remains locked in a narrow range between $144.50 and $149.30, with volatility compression visible across Bollinger Bands and Keltner Channels. This setup typically precedes sharp directional moves. Key support sits at $144.56, near the 100 EMA on the 15-minute chart. Holding this level could allow bulls to retest $149 and target $155.43 on a breakout. A drop below $144.50, however, risks deeper retracement toward $141.65 and the 200 EMA near $140.89.
As previously discussed, Solana has maintained a supportive long-term trend, but near-term momentum remains fragile. Without a clean break above the $149–$150 ceiling, choppy range-bound action is likely to persist heading into May 9.


Latest Solana News


-
 Afghanistan
-
 Albania
-
 Algeria
-
 Angola
-
 Argentina
-
 Armenia
-
 Australia
-
 Austria
-
 Azerbaijan
-
 Bahamas
-
 Bahrain
-
 Bangladesh
-
 Belarus
-
 Belgium
-
 Bolivia
-
 Botswana
-
 Brazil
-
 Brunei
-
 Bulgaria
-
 Cambodia
-
 Cameroon
-
 Canada
-
 Chile
Chile
-
 China
China
-
 Colombia
-
 Congo
Congo
-
 Costa Rica
-
 Cote d'Ivoire
-
 Croatia
-
 Cuba
Cuba
-
 Cyprus
-
 Czechia
-
 DR Congo
-
 Denmark
-
 Dominican Republic
-
 Ecuador
-
 Egypt
Egypt
-
 El Salvador
-
 Estonia
-
 Eswatini
-
 Ethiopia
-
 Finland
-
 France
-
 Georgia
-
 Germany
-
 Ghana
Ghana
-
 Greece
-
 Haiti
Haiti
-
 Hong Kong
-
 Hungary
-
 India
India
-
 Indonesia
-
 Iran, Islamic republic
-
 Iraq
Iraq
-
 Ireland
-
 Israel
-
 Italy
Italy
-
 Jamaica
-
 Japan
Japan
-
 Jordan
-
 Kazakhstan
-
 Kenya
Kenya
-
 Korea
Korea
-
 Kuwait
-
 Kyrgyzstan
-
 Laos
Laos
-
 Latvia
-
 Lebanon
-
 Lesotho
-
 Libya
Libya
-
 Lithuania
-
 Luxembourg
-
 Madagascar
-
 Malaysia
-
 Malta
Malta
-
 Mauritius
-
 Mexico
-
 Moldova
-
 Mongolia
-
 Montenegro
-
 Morocco
-
 Mozambique
-
 Myanmar
-
 Namibia
-
 Nepal
Nepal
-
 Netherlands
-
 New Zealand
-
 Nigeria
-
 North Macedonia
-
 Norway
-
 Oman
Oman
-
 Pakistan
-
 Palestine
-
 Panama
-
 Papua New Guinea
-
 Paraguay
-
 Peru
Peru
-
 Philippines
-
 Poland
-
 Portugal
-
 Puerto Rico
-
 Qatar
Qatar
-
 Reunion
-
 Romania
-
 Rwanda
-
 Saudi Arabia
-
 Serbia
-
 Singapore
-
 Slovakia
-
 Slovenia
-
 Somalia
-
 South Africa
-
 Spain
Spain
-
 Sri Lanka
-
 Sweden
-
 Switzerland
-
 Syria
Syria
-
 Taiwan
-
 Tajikistan
-
 Tanzania
-
 Thailand
-
 Trinidad and Tobago
-
 Tunisia
-
 Turkey
-
 UAE
UAE
-
 Uganda
-
 Ukraine
-
 United Kingdom
-
United States
-
 Uruguay
-
 Uzbekistan
-
 Venezuela
-
 Vietnam
-
 Yemen
Yemen
-
 Zambia
-
 Zimbabwe
- Forex
- Crypto
