
Ethereum edges lower as U.S. spot Ethereum ETF net inflows fail to spark buying

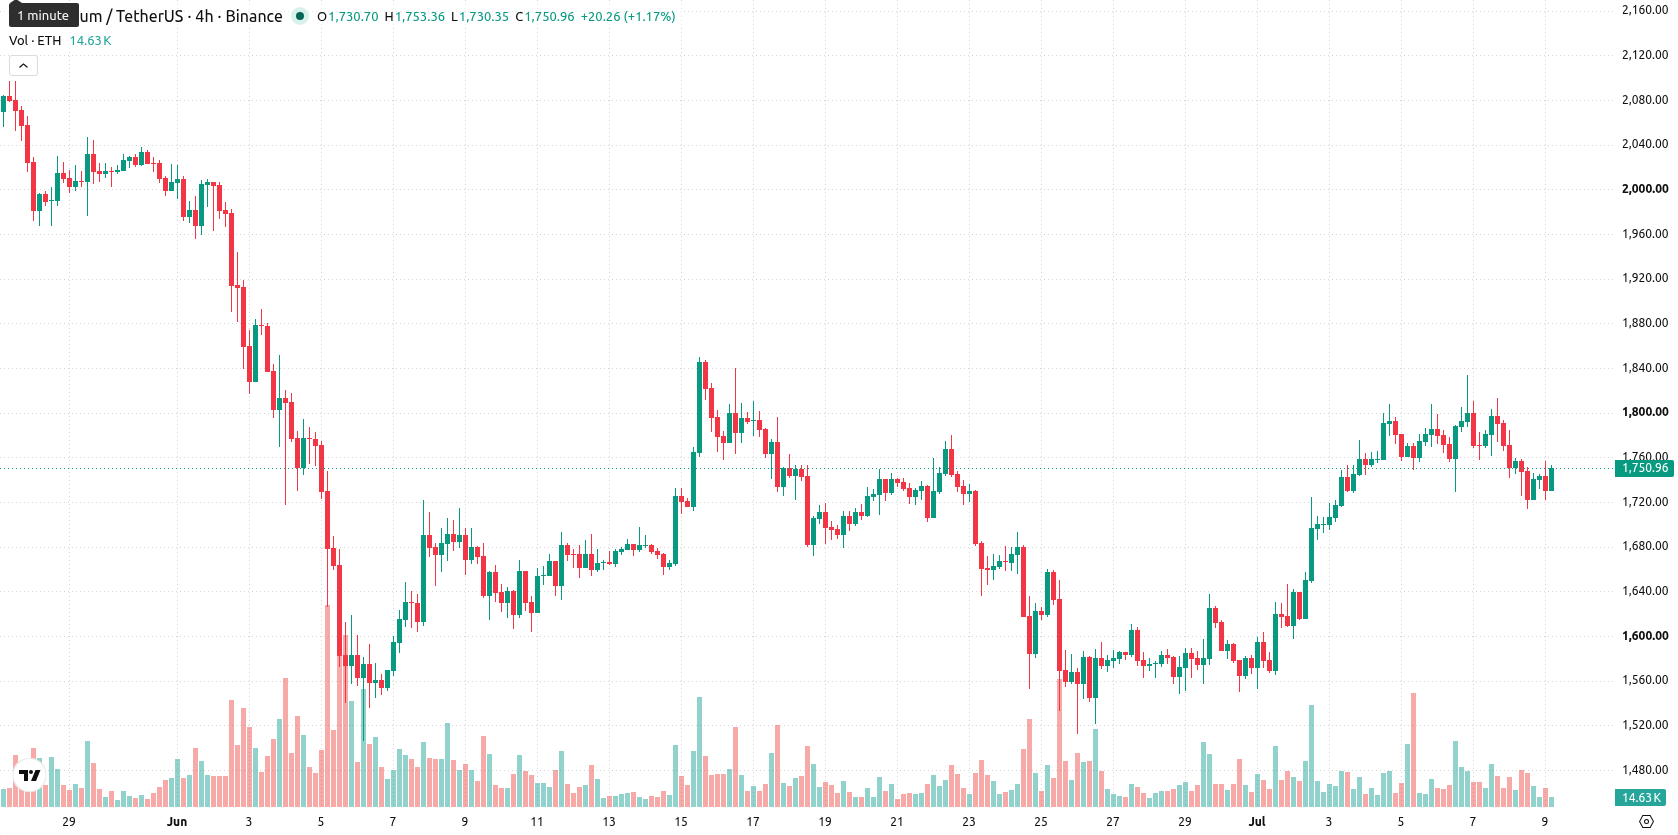
Ethereum (ETH) is trading at $1,749.82 after a modest daily decline, remaining below its key short- and long-term moving averages while still holding above an intermediate trend level.
 1802.99
1833.40
1802.99
1833.40
Highlights
- U.S. spot Ethereum ETFs saw net inflows of $26.9 million on July 7, 2026, signaling persistent institutional demand.
- Four consecutive sessions of positive inflows suggest sustained interest in regulated Ethereum exposure despite muted overall trading activity.
- ETH/USD faces bearish technical pressure, likely to trade between $1,687 and $1,896, with downside favored and resistance at $1,773.
Institutional inflows continue as ETF demand bolsters liquidity
U.S. spot Ethereum exchange-traded funds attracted $26.9 million in net inflows on July 7, 2026, marking the fourth consecutive trading session of positive institutional demand, according to Farside Investors. These cumulative inflows suggest ongoing interest from U.S. market participants seeking direct and regulated exposure to Ethereum. Such persistent ETF demand helps deepen market liquidity and indicates sustained appetite among long-term investors, even as broader trading remained subdued.
Conflicting momentum signals as segmented trend creates indecision
On the H4 timeframe, ETH is trading below both the 20-period and 200-period moving averages while remaining above the 50-period moving average, highlighting a segmented trend structure. Immediate resistance is defined by the Ichimoku Kijun at $1,773, and support is established at $1,687. Relative Strength Index (RSI) is at 43.25 and the Commodity Channel Index (CCI) indicates oversold conditions, both suggesting price exhaustion on the downside. The Awesome Oscillator points toward continuing sell momentum, while the Average Directional Index (ADX) flashes a buy signal and Moving Average Convergence Divergence (MACD) remains neutral, creating a divergence between trend and momentum indicators. Stochastic RSI and CCI are deeply oversold, whereas Bull/Bear Power readings are overbought intraday, illustrating conflicting short-term sentiment amid moderate volatility.
Range-bound trading likely as upside depends on resistance breakout
Over the coming days, ETH is expected to trade within a typical volatility band ranging from $1,687 to $1,896. There is a 60% probability of further downside, while the chance of an upside move is 40%. The baseline expectation is for ETH to remain range-bound. A clear bullish scenario would require a sustained breakout above the immediate resistance at $1,773, while a close below support at $1,687 could open the way for additional declines.
Earlier, analysts noted that Ethereum was trading under persistent bearish pressure, with investors awaiting clear signals for a trend reversal amid mixed technical and institutional cues. The latest data on sustained ETF inflows adds a new dimension, suggesting that while downside risk remains, an upside breakout above $1,773 could quickly shift momentum and warrant close attention from traders.



Latest Ethereum News







-
 Afghanistan
-
 Albania
-
 Algeria
-
 Angola
-
 Argentina
-
 Armenia
-
 Australia
-
 Austria
-
 Azerbaijan
-
 Bahamas
-
 Bahrain
-
 Bangladesh
-
 Belarus
-
 Belgium
-
 Bolivia
-
 Botswana
-
 Brazil
-
 Brunei
-
 Bulgaria
-
 Cambodia
-
 Cameroon
-
 Canada
-
 Chile
Chile
-
 China
China
-
 Colombia
-
 Congo
Congo
-
 Costa Rica
-
 Cote d'Ivoire
-
 Croatia
-
 Cuba
Cuba
-
 Cyprus
-
 Czechia
-
 DR Congo
-
 Denmark
-
 Dominican Republic
-
 Ecuador
-
 Egypt
Egypt
-
 El Salvador
-
 Estonia
-
 Eswatini
-
 Ethiopia
-
 Finland
-
 France
-
 Georgia
-
 Germany
-
 Ghana
Ghana
-
 Greece
-
 Haiti
Haiti
-
 Hong Kong
-
 Hungary
-
 India
India
-
 Indonesia
-
 Iran, Islamic republic
-
 Iraq
Iraq
-
 Ireland
-
 Israel
-
 Italy
Italy
-
 Jamaica
-
 Japan
Japan
-
 Jordan
-
 Kazakhstan
-
 Kenya
Kenya
-
 Korea
Korea
-
 Kuwait
-
 Kyrgyzstan
-
 Laos
Laos
-
 Latvia
-
 Lebanon
-
 Lesotho
-
 Libya
Libya
-
 Lithuania
-
 Luxembourg
-
 Madagascar
-
 Malaysia
-
 Malta
Malta
-
 Mauritius
-
 Mexico
-
 Moldova
-
 Mongolia
-
 Montenegro
-
 Morocco
-
 Mozambique
-
 Myanmar
-
 Namibia
-
 Nepal
Nepal
-
 Netherlands
-
 New Zealand
-
 Nigeria
-
 North Macedonia
-
 Norway
-
 Oman
Oman
-
 Pakistan
-
 Palestine
-
 Panama
-
 Papua New Guinea
-
 Paraguay
-
 Peru
Peru
-
 Philippines
-
 Poland
-
 Portugal
-
 Puerto Rico
-
 Qatar
Qatar
-
 Reunion
-
 Romania
-
 Rwanda
-
 Saudi Arabia
-
 Serbia
-
 Singapore
-
 Slovakia
-
 Slovenia
-
 Somalia
-
 South Africa
-
 Spain
Spain
-
 Sri Lanka
-
 Sweden
-
 Switzerland
-
 Syria
Syria
-
 Taiwan
-
 Tajikistan
-
 Tanzania
-
 Thailand
-
 Trinidad and Tobago
-
 Tunisia
-
 Turkey
-
 UAE
UAE
-
 Uganda
-
 Ukraine
-
 United Kingdom
-
United States
-
 Uruguay
-
 Uzbekistan
-
 Venezuela
-
 Vietnam
-
 Yemen
Yemen
-
 Zambia
-
 Zimbabwe
- Forex
- Crypto











