

CRV supply reduction scheduled for mid-August: What’s next for CRV?

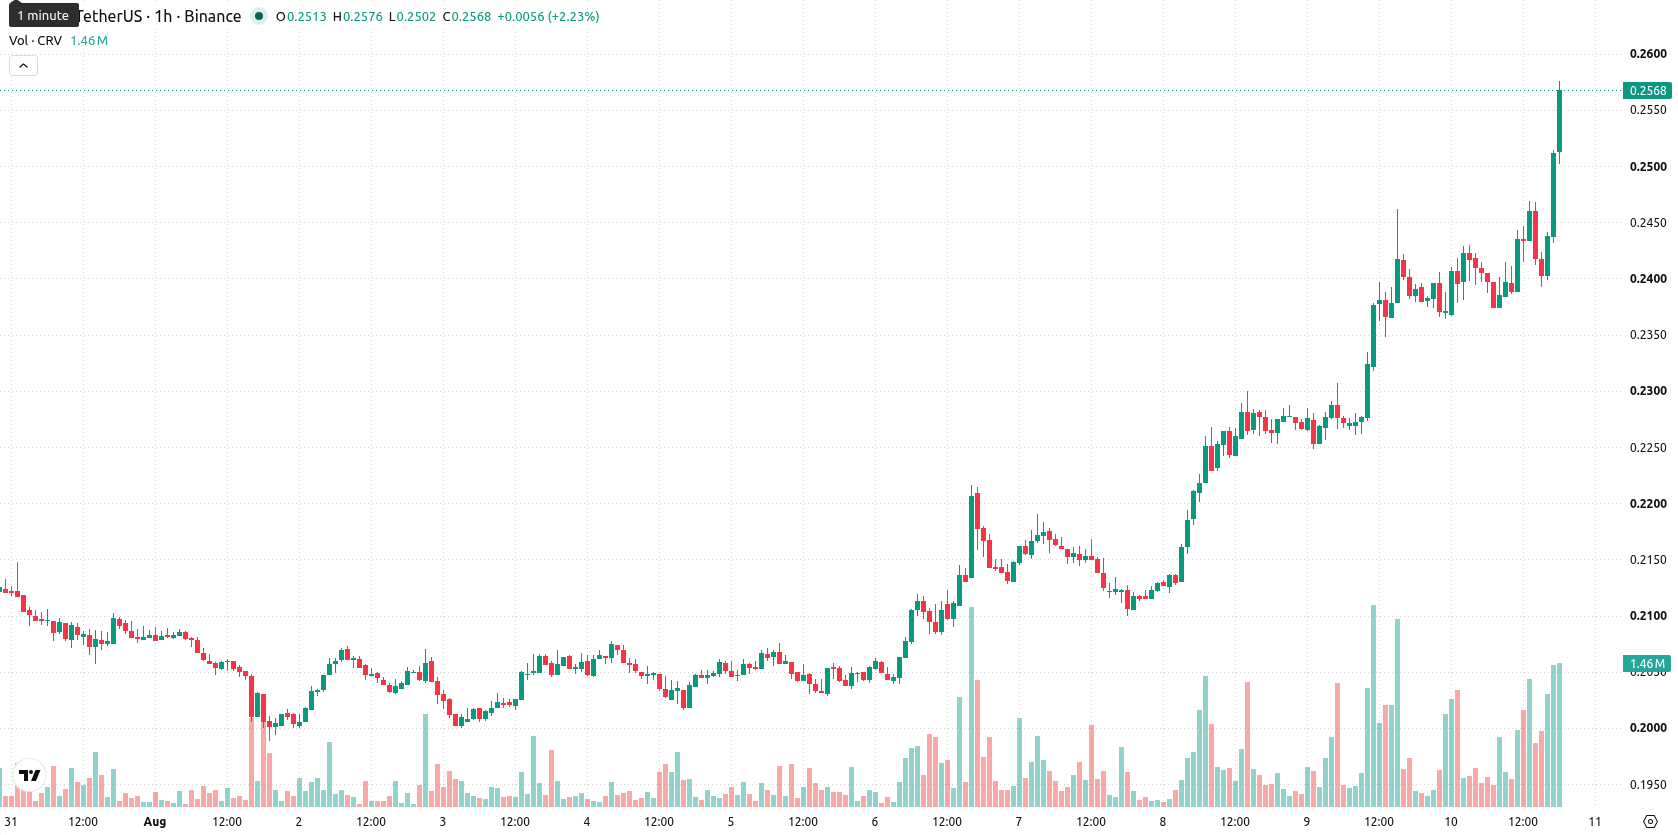
Curve (CRV) is trading at $0.2553, posting a 7.22% gain on the day with price action currently positioned above its key moving averages. The asset is maintaining momentum near today’s high, reflecting strong upward movement in the short term.
 0.3432
0.3996
0.3432
0.3996
Highlights
- Curve's annual 15.9% reduction in CRV emissions imposes deflationary pressure, directly limiting new supply and supporting demand.
- Growing protocol activity, including higher Llamalend TVL and increased crvUSD minting, signals expanding CRV utility and supports the ongoing rally.
- CRV is exhibiting strong bullish momentum with a projected price range of $0.2451 to $0.2653 over the next few days and a high probability of further upside.
Deflationary supply cut and rising protocol activity drive demand-led rally
Curve’s token contract implements an annual reduction in CRV emissions by 15.9%, with the next scheduled supply cut set for mid-August. This mechanism directly limits new CRV entering circulation, creating a deflationary effect that supports buying interest. Meanwhile, the August 6 ecosystem update noted expanding protocol activity, as Llamalend’s TVL, borrowing, and supplied capital all posted mid-single-digit percentage gains for the week and crvUSD minting continued to rise, reflecting increased CRV utility. These developments, together with trading volume outpacing its 30-day average and the reported $364.58 million market capitalization, support the current demand-driven rally according to Diariobitcoin.
Bullish signals dominate as overbought readings heighten caution
On the H1 timeframe, CRV is trading above the MA-20 at $0.241 and the MA-50 at $0.2354, with price remaining above the daily MA-200 at $0.2323. Immediate support is found at the Ichimoku Kijun level of $0.2423. Momentum indicators confirm strong buying—MACD and ADX both signal bullish conditions, Bull/Bear Power shows clear buyer dominance, while RSI at 65 and CCI indicate overbought territory. The Stochastic RSI is neutral, and the Awesome Oscillator remains flat, suggesting that while upward momentum is pronounced, there are emerging signs of oscillator divergence and caution is warranted as overbought signals accumulate.
Breakout potential rises as consolidation persists within set range
Over the next two to three trading days, CRV is expected to remain within the $0.2451 to $0.2653 range. The probability of a continued move higher is estimated to be above 80%, with downside risk below 20%. The main scenario anticipates a consolidation phase in the current sideways channel; however, a sustained breakout above the upper boundary would signal a bullish extension, while a drop below immediate support would be the cue for short-term retracement.
Previously it was reported that Curve was showing strong short-term momentum and bullish technical signals, with the potential for further gains if upside conditions persisted. The current analysis strengthens this view as Curve maintains its rally on robust trading volume and ecosystem growth, with the key catalyst now being a confirmed breakout or breakdown beyond the $0.2451 to $0.2653 range in the coming sessions.









-
 Afghanistan
-
 Albania
-
 Algeria
-
 Angola
-
 Argentina
-
 Armenia
-
 Australia
-
 Austria
-
 Azerbaijan
-
 Bahamas
-
 Bahrain
-
 Bangladesh
-
 Belarus
-
 Belgium
-
 Bolivia
-
 Botswana
-
 Brazil
-
 Brunei
-
 Bulgaria
-
 Cambodia
-
 Cameroon
-
 Canada
-
 Chile
Chile
-
 China
China
-
 Colombia
-
 Congo
Congo
-
 Costa Rica
-
 Cote d'Ivoire
-
 Croatia
-
 Cuba
Cuba
-
 Cyprus
-
 Czechia
-
 DR Congo
-
 Denmark
-
 Dominican Republic
-
 Ecuador
-
 Egypt
Egypt
-
 El Salvador
-
 Estonia
-
 Eswatini
-
 Ethiopia
-
 Finland
-
 France
-
 Georgia
-
 Germany
-
 Ghana
Ghana
-
 Greece
-
 Haiti
Haiti
-
 Hong Kong
-
 Hungary
-
 India
India
-
 Indonesia
-
 Iran, Islamic republic
-
 Iraq
Iraq
-
 Ireland
-
 Israel
-
 Italy
Italy
-
 Jamaica
-
 Japan
Japan
-
 Jordan
-
 Kazakhstan
-
 Kenya
Kenya
-
 Korea
Korea
-
 Kuwait
-
 Kyrgyzstan
-
 Laos
Laos
-
 Latvia
-
 Lebanon
-
 Lesotho
-
 Libya
Libya
-
 Lithuania
-
 Luxembourg
-
 Madagascar
-
 Malaysia
-
 Malta
Malta
-
 Mauritius
-
 Mexico
-
 Moldova
-
 Mongolia
-
 Montenegro
-
 Morocco
-
 Mozambique
-
 Myanmar
-
 Namibia
-
 Nepal
Nepal
-
 Netherlands
-
 New Zealand
-
 Nigeria
-
 North Macedonia
-
 Norway
-
 Oman
Oman
-
 Pakistan
-
 Palestine
-
 Panama
-
 Papua New Guinea
-
 Paraguay
-
 Peru
Peru
-
 Philippines
-
 Poland
-
 Portugal
-
 Puerto Rico
-
 Qatar
Qatar
-
 Reunion
-
 Romania
-
 Rwanda
-
 Saudi Arabia
-
 Serbia
-
 Singapore
-
 Slovakia
-
 Slovenia
-
 Somalia
-
 South Africa
-
 Spain
Spain
-
 Sri Lanka
-
 Sweden
-
 Switzerland
-
 Syria
Syria
-
 Taiwan
-
 Tajikistan
-
 Tanzania
-
 Thailand
-
 Trinidad and Tobago
-
 Tunisia
-
 Turkey
-
 UAE
UAE
-
 Uganda
-
 Ukraine
-
 United Kingdom
-
United States
-
 Uruguay
-
 Uzbekistan
-
 Venezuela
-
 Vietnam
-
 Yemen
Yemen
-
 Zambia
-
 Zimbabwe
- Forex
- Crypto












