


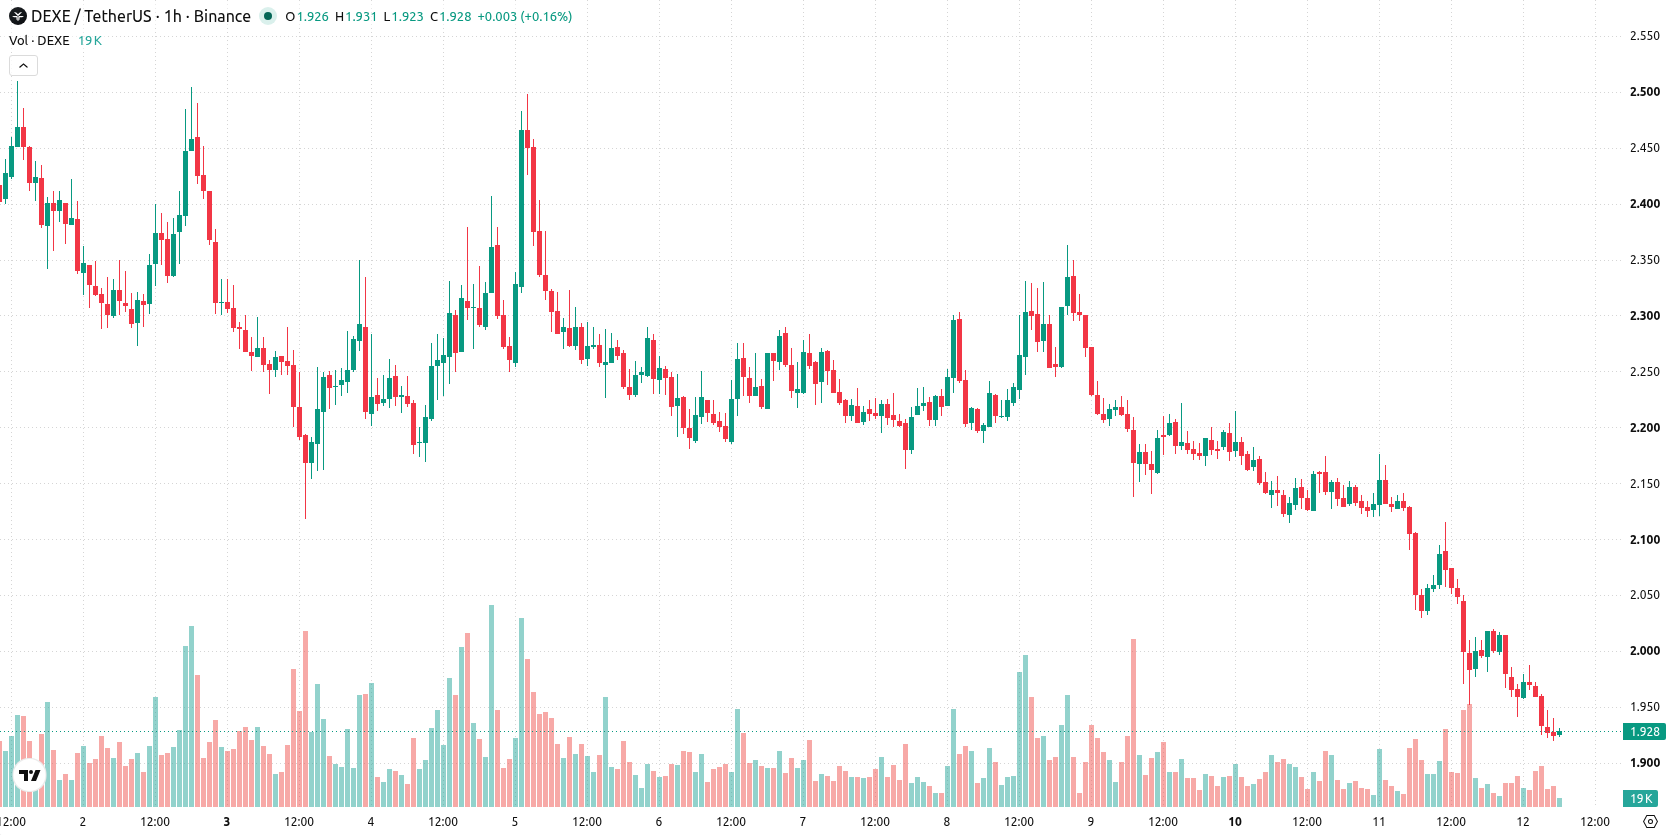
DeXe (DEXE) is trading at $1.93, marking a drop of 7.27% on the day. The asset is positioned below its key moving averages, indicating ongoing weakness relative to recent price trends.
 1.47
1.64
Highlights
- DEXE/USD trades below key moving averages, showing persistent seller dominance across short, medium, and long-term outlooks.
- Momentum indicators such as MACD, ADX, and RSI present a strong sell bias with the asset in deeply oversold territory.
- Price range forecast for the next two to three days is $1.72 to $2.02 with a high probability of continued decline unless $2.03 resistance is breached.
Bearish momentum dominates as DEXE breaches key supports
DEXE is currently trading below the MA-20 at $1.99, the MA-50 at $2.07, and the long-term MA-200 at $11.55. Immediate resistance is defined by the Ichimoku Kijun at $2.03, while downside support is seen near $1.72. Momentum indicators show a dominant Sell bias with both MACD and ADX aligned to the downside, and RSI at 28.54 together with CCI and Stoch RSI signaling oversold conditions. Bull/Bear Power confirms sellers are in control, although the Awesome Oscillator remains neutral.
Downside risk prevails as volatility heightens
Over the next two to three sessions, DEXE is expected to trade within a volatility band of $1.72 to $2.02. The probability of a move higher is very low, while the likelihood of further downside is elevated. A break below the $1.72 support could trigger additional declines, whereas a rebound would require a firm move above $2.03 to alter the current scenario.
Earlier, analysts noted that DeXe was exhibiting persistent bearish momentum with elevated downside risk as technical indicators pointed to limited upside. The current analysis corroborates this outlook, with the prevailing scenario suggesting that a move below the $1.72 support remains the key level to monitor for potential further weakness.










-
 Afghanistan
-
 Albania
-
 Algeria
-
 Angola
-
 Argentina
-
 Armenia
-
 Australia
-
 Austria
-
 Azerbaijan
-
 Bahamas
-
 Bahrain
-
 Bangladesh
-
 Belarus
-
 Belgium
-
 Bolivia
-
 Botswana
-
 Brazil
-
 Brunei
-
 Bulgaria
-
 Cambodia
-
 Cameroon
-
 Canada
-
 Chile
-
 China
-
 Colombia
-
 Congo
-
 Costa Rica
-
 Cote d'Ivoire
-
 Croatia
-
 Cuba
-
 Cyprus
-
 Czechia
-
 DR Congo
-
 Denmark
-
 Dominican Republic
-
 Ecuador
-
 Egypt
-
 El Salvador
-
 Estonia
-
 Eswatini
-
 Ethiopia
-
 Finland
-
 France
-
 Georgia
-
 Germany
-
 Ghana
-
 Greece
-
 Haiti
-
 Hong Kong
-
 Hungary
-
 India
-
 Indonesia
-
 Iran, Islamic republic
-
 Iraq
-
 Ireland
-
 Israel
-
 Italy
-
 Jamaica
-
 Japan
-
 Jordan
-
 Kazakhstan
-
 Kenya
-
 Korea
-
 Kuwait
-
 Kyrgyzstan
-
 Laos
-
 Latvia
-
 Lebanon
-
 Lesotho
-
 Libya
-
 Lithuania
-
 Luxembourg
-
 Madagascar
-
 Malaysia
-
 Malta
-
 Mauritius
-
 Mexico
-
 Moldova
-
 Mongolia
-
 Montenegro
-
 Morocco
-
 Mozambique
-
 Myanmar
-
 Namibia
-
 Nepal
-
 Netherlands
-
 New Zealand
-
 Nigeria
-
 North Macedonia
-
 Norway
-
 Oman
-
 Pakistan
-
 Palestine
-
 Panama
-
 Papua New Guinea
-
 Paraguay
-
 Peru
-
 Philippines
-
 Poland
-
 Portugal
-
 Puerto Rico
-
 Qatar
-
 Reunion
-
 Romania
-
 Rwanda
-
 Saudi Arabia
-
 Serbia
-
 Singapore
-
 Slovakia
-
 Slovenia
-
 Somalia
-
 South Africa
-
 Spain
-
 Sri Lanka
-
 Sweden
-
 Switzerland
-
 Syria
-
 Taiwan
-
 Tajikistan
-
 Tanzania
-
 Thailand
-
 Trinidad and Tobago
-
 Tunisia
-
 Turkey
-
 UAE
-
 Uganda
-
 Ukraine
-
 United Kingdom
-
United States
-
 Uruguay
-
 Uzbekistan
-
 Venezuela
-
 Vietnam
-
 Yemen
-
 Zambia
-
 Zimbabwe
- Forex
- Crypto












