

Why is Uniswap falling today? Key support levels to watch after recent selloff

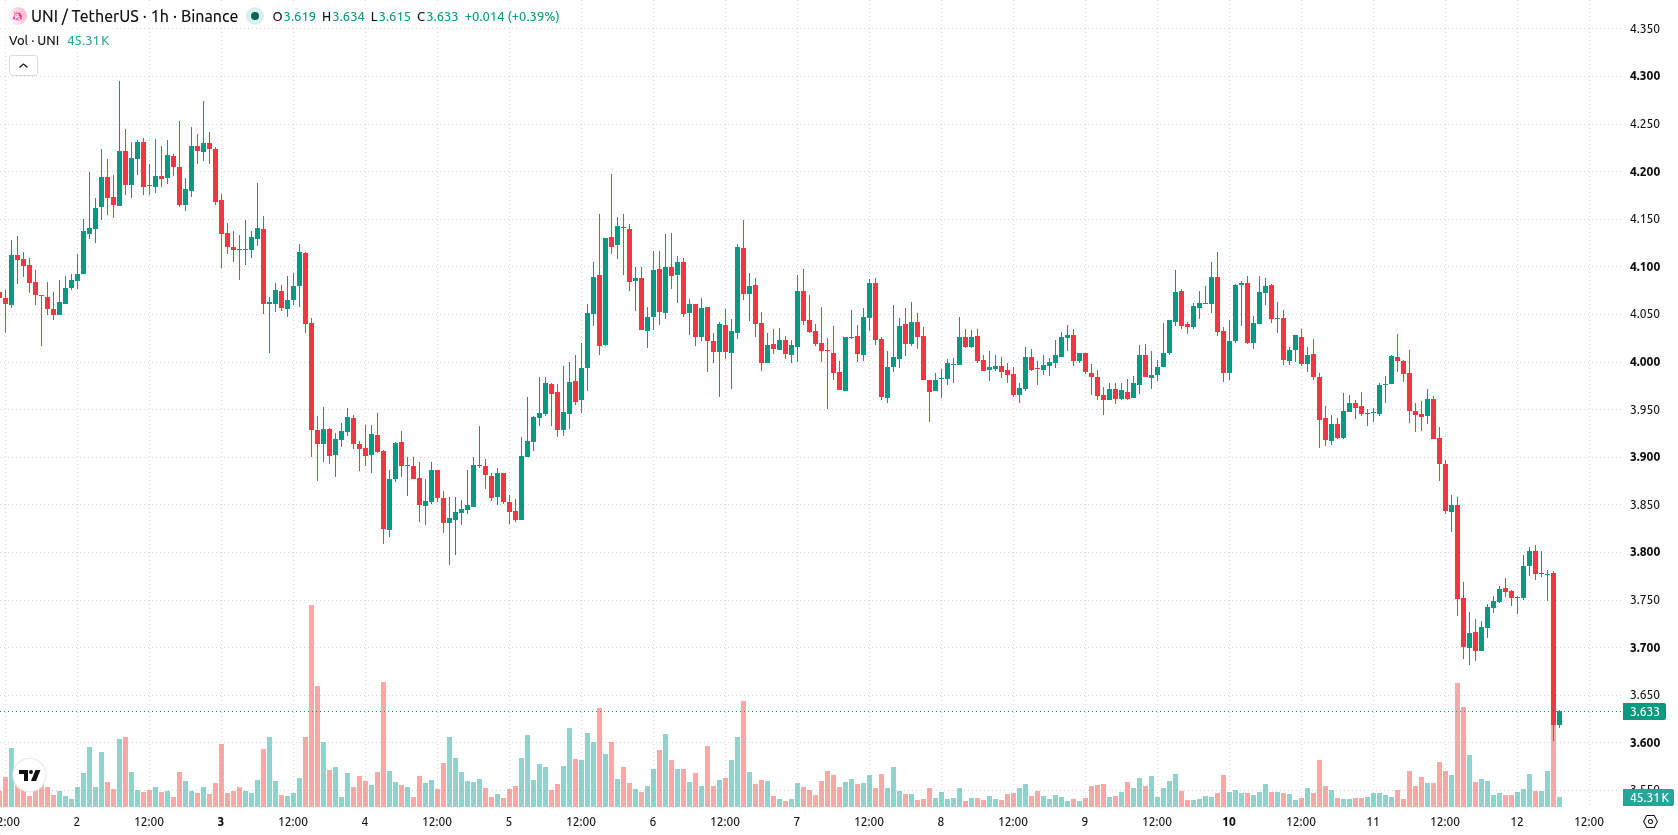
Uniswap (UNI) is trading at $3.626, down 8.18% for the session. The price is currently below its key short- and medium-term moving averages, while remaining above a crucial long-term average.
 7.68
8.0290
7.68
8.0290
Highlights
- Uniswap broke below key support as trading volume remained under its 30-day average, indicating weaker demand and liquidity.
- Thin trading conditions have intensified recent selling, exposing Uniswap to larger price swings and negative sentiment.
- UNI/USD dropped 8.18% to $3.626 and momentum indicators confirm strong short-term selling, with a projected range of $3.5214 to $3.9 and high probability of continued downside.
Diminished liquidity and weak demand drive intensified selling pressure
Uniswap broke through key support levels as trading volume remained below the 30-day average, a pattern often associated with diminished liquidity and weaker demand from market participants. The lower volume can exacerbate price swings, making assets more vulnerable to sharper moves when technical levels fail. This environment has contributed to prevailing negative sentiment and intensified selling pressure in recent trading.
Downward momentum persists as intraday sellers outpace mixed oscillators
On the technical front, UNI/USD is trading below its MA-20 and MA-50 on the h1 timeframe, indicating persistent short- to medium-term downward momentum. The price remains positioned above the long-term MA-200, offering some degree of underlying support. The nearest Ichimoku Kijun resistance level stands at $3.855. MACD signals a strong sell, and ADX shows a prevailing sell environment. RSI is at 40.9—a selling zone—while Stochastic RSI is in overbought territory and CCI is neutral. Bull/Bear Power confirms sellers are dominating intraday momentum, although mixed signals among oscillators suggest market caution.
Renewed downside risk as rangebound outlook skews bearish
Over the next 2–3 trading days, UNI/USD is expected to trade within a range of $3.5214 to $3.9 based on recent volatility and technical setups. A move above $3.855 could prompt a test of the higher range, while a drop below $3.5214 would increase the likelihood of further downside continuation. The baseline scenario is for rangebound price action, with a high probability skewed toward renewed weakness unless bullish momentum reemerges.
Earlier, analysts noted that renewed protocol activity and bullish technical signals had established a supportive foundation for Uniswap. However, with UNI now trading below key short- and medium-term averages and downside momentum building, traders should monitor the $3.5214 support level for potential escalation of selling pressure if it fails to hold.





Latest Uniswap (UNI) News





-
 Afghanistan
-
 Albania
-
 Algeria
-
 Angola
-
 Argentina
-
 Armenia
-
 Australia
-
 Austria
-
 Azerbaijan
-
 Bahamas
-
 Bahrain
-
 Bangladesh
-
 Belarus
-
 Belgium
-
 Bolivia
-
 Botswana
-
 Brazil
-
 Brunei
-
 Bulgaria
-
 Cambodia
-
 Cameroon
-
 Canada
-
 Chile
Chile
-
 China
China
-
 Colombia
-
 Congo
Congo
-
 Costa Rica
-
 Cote d'Ivoire
-
 Croatia
-
 Cuba
Cuba
-
 Cyprus
-
 Czechia
-
 DR Congo
-
 Denmark
-
 Dominican Republic
-
 Ecuador
-
 Egypt
Egypt
-
 El Salvador
-
 Estonia
-
 Eswatini
-
 Ethiopia
-
 Finland
-
 France
-
 Georgia
-
 Germany
-
 Ghana
Ghana
-
 Greece
-
 Haiti
Haiti
-
 Hong Kong
-
 Hungary
-
 India
India
-
 Indonesia
-
 Iran, Islamic republic
-
 Iraq
Iraq
-
 Ireland
-
 Israel
-
 Italy
Italy
-
 Jamaica
-
 Japan
Japan
-
 Jordan
-
 Kazakhstan
-
 Kenya
Kenya
-
 Korea
Korea
-
 Kuwait
-
 Kyrgyzstan
-
 Laos
Laos
-
 Latvia
-
 Lebanon
-
 Lesotho
-
 Libya
Libya
-
 Lithuania
-
 Luxembourg
-
 Madagascar
-
 Malaysia
-
 Malta
Malta
-
 Mauritius
-
 Mexico
-
 Moldova
-
 Mongolia
-
 Montenegro
-
 Morocco
-
 Mozambique
-
 Myanmar
-
 Namibia
-
 Nepal
Nepal
-
 Netherlands
-
 New Zealand
-
 Nigeria
-
 North Macedonia
-
 Norway
-
 Oman
Oman
-
 Pakistan
-
 Palestine
-
 Panama
-
 Papua New Guinea
-
 Paraguay
-
 Peru
Peru
-
 Philippines
-
 Poland
-
 Portugal
-
 Puerto Rico
-
 Qatar
Qatar
-
 Reunion
-
 Romania
-
 Rwanda
-
 Saudi Arabia
-
 Serbia
-
 Singapore
-
 Slovakia
-
 Slovenia
-
 Somalia
-
 South Africa
-
 Spain
Spain
-
 Sri Lanka
-
 Sweden
-
 Switzerland
-
 Syria
Syria
-
 Taiwan
-
 Tajikistan
-
 Tanzania
-
 Thailand
-
 Trinidad and Tobago
-
 Tunisia
-
 Turkey
-
 UAE
UAE
-
 Uganda
-
 Ukraine
-
 United Kingdom
-
United States
-
 Uruguay
-
 Uzbekistan
-
 Venezuela
-
 Vietnam
-
 Yemen
Yemen
-
 Zambia
-
 Zimbabwe
- Forex
- Crypto












