

Why is Curve falling today? Weak momentum raises risk for $0.2309 support test

Curve (CRV) is trading at $0.2543, reflecting a daily decline of 7.7%. The price currently sits below its key moving averages, indicating ongoing selling pressure in the short and medium term.
 0.3743
0.3996
0.3743
0.3996
Highlights
- Open interest in CRV futures increased 15% to $57.4 million, indicating a surge of new capital into Curve derivatives.
- Curve's daily trading turnover reached $111.8 million, tripling its 30-day average as both institutional and retail activity grew.
- CRV/USD trades below key moving averages with persistent bearish momentum and is projected to range from $0.2372 to $0.2714 in the next 2 to 3 days.
Volatility risk rises as open interest and volume surge
Open Interest in CRV futures rose by 15% to $57.4 million, indicating an influx of fresh capital into Curve’s derivatives market rather than adjustments within existing positions, according to Pluang. This increased participation has the potential to amplify both volatility and liquidity, shaping trading dynamics even as broader market sentiment remains cautious. Additionally, transaction volume has seen a notable spike, with Curve’s daily trading turnover hitting $111.8 million — three times the 30-day average, based on data from Diariobitcoin. These developments reflect heightened institutional and retail engagement, though price action has remained under broader selling pressure.
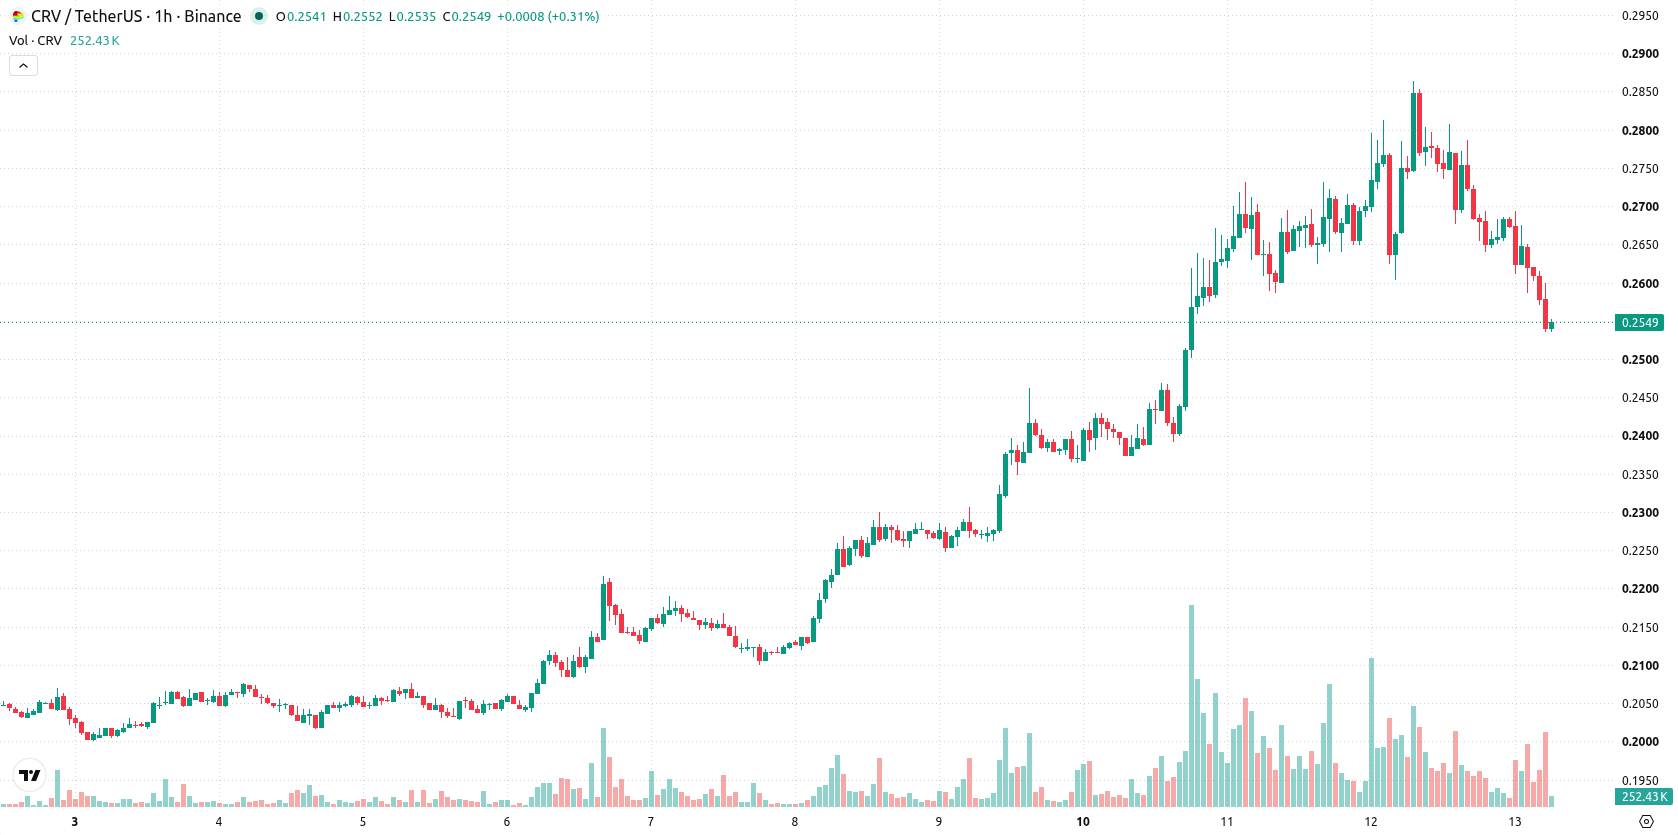
Downside momentum persists as support holds and resistance caps price
Technically, CRV is positioned below both the MA-20 and MA-50 on the hourly chart, while maintaining support above the MA-200 at $0.2309. The Ichimoku Kijun at $0.2718 marks immediate resistance. Momentum indicators point to persistent weakness, as MACD and ADX both show Sell signals. The RSI stands at 36.5, with Stochastic RSI and CCI both in the oversold zone. Bull/Bear Power remains negative intraday, confirming sellers' dominance, and the Awesome Oscillator aligns with the prevailing bearish momentum amid increased volatility, with no divergence detected.
Bearish bias favored as volatility bands define next moves
Over the next 2–3 trading days, CRV is likely to fluctuate within a volatility band of $0.2372 to $0.2714. The probability of a downward move outweighs the chances for a rebound, with a 67% likelihood of further declines and only a 33% chance of breaking higher. The baseline scenario involves sideways movement between support and resistance, while a stronger rally would require a clear move above the Ichimoku Kijun, and further losses could be triggered if $0.2372 support is breached.
Earlier, analysts noted that Curve was displaying bullish momentum supported by robust on-chain activity and protocol incentives. The current analysis signals a notable shift, emphasizing persistent selling pressure and heightened volatility, with an increased risk of further downside should the $0.2372 support level fail to hold.









-
 Afghanistan
-
 Albania
-
 Algeria
-
 Angola
-
 Argentina
-
 Armenia
-
 Australia
-
 Austria
-
 Azerbaijan
-
 Bahamas
-
 Bahrain
-
 Bangladesh
-
 Belarus
-
 Belgium
-
 Bolivia
-
 Botswana
-
 Brazil
-
 Brunei
-
 Bulgaria
-
 Cambodia
-
 Cameroon
-
 Canada
-
 Chile
Chile
-
 China
China
-
 Colombia
-
 Congo
Congo
-
 Costa Rica
-
 Cote d'Ivoire
-
 Croatia
-
 Cuba
Cuba
-
 Cyprus
-
 Czechia
-
 DR Congo
-
 Denmark
-
 Dominican Republic
-
 Ecuador
-
 Egypt
Egypt
-
 El Salvador
-
 Estonia
-
 Eswatini
-
 Ethiopia
-
 Finland
-
 France
-
 Georgia
-
 Germany
-
 Ghana
Ghana
-
 Greece
-
 Haiti
Haiti
-
 Hong Kong
-
 Hungary
-
 India
India
-
 Indonesia
-
 Iran, Islamic republic
-
 Iraq
Iraq
-
 Ireland
-
 Israel
-
 Italy
Italy
-
 Jamaica
-
 Japan
Japan
-
 Jordan
-
 Kazakhstan
-
 Kenya
Kenya
-
 Korea
Korea
-
 Kuwait
-
 Kyrgyzstan
-
 Laos
Laos
-
 Latvia
-
 Lebanon
-
 Lesotho
-
 Libya
Libya
-
 Lithuania
-
 Luxembourg
-
 Madagascar
-
 Malaysia
-
 Malta
Malta
-
 Mauritius
-
 Mexico
-
 Moldova
-
 Mongolia
-
 Montenegro
-
 Morocco
-
 Mozambique
-
 Myanmar
-
 Namibia
-
 Nepal
Nepal
-
 Netherlands
-
 New Zealand
-
 Nigeria
-
 North Macedonia
-
 Norway
-
 Oman
Oman
-
 Pakistan
-
 Palestine
-
 Panama
-
 Papua New Guinea
-
 Paraguay
-
 Peru
Peru
-
 Philippines
-
 Poland
-
 Portugal
-
 Puerto Rico
-
 Qatar
Qatar
-
 Reunion
-
 Romania
-
 Rwanda
-
 Saudi Arabia
-
 Serbia
-
 Singapore
-
 Slovakia
-
 Slovenia
-
 Somalia
-
 South Africa
-
 Spain
Spain
-
 Sri Lanka
-
 Sweden
-
 Switzerland
-
 Syria
Syria
-
 Taiwan
-
 Tajikistan
-
 Tanzania
-
 Thailand
-
 Trinidad and Tobago
-
 Tunisia
-
 Turkey
-
 UAE
UAE
-
 Uganda
-
 Ukraine
-
 United Kingdom
-
United States
-
 Uruguay
-
 Uzbekistan
-
 Venezuela
-
 Vietnam
-
 Yemen
Yemen
-
 Zambia
-
 Zimbabwe
- Forex
- Crypto












