

Will Quant regain momentum as overextended rally takes a breather?

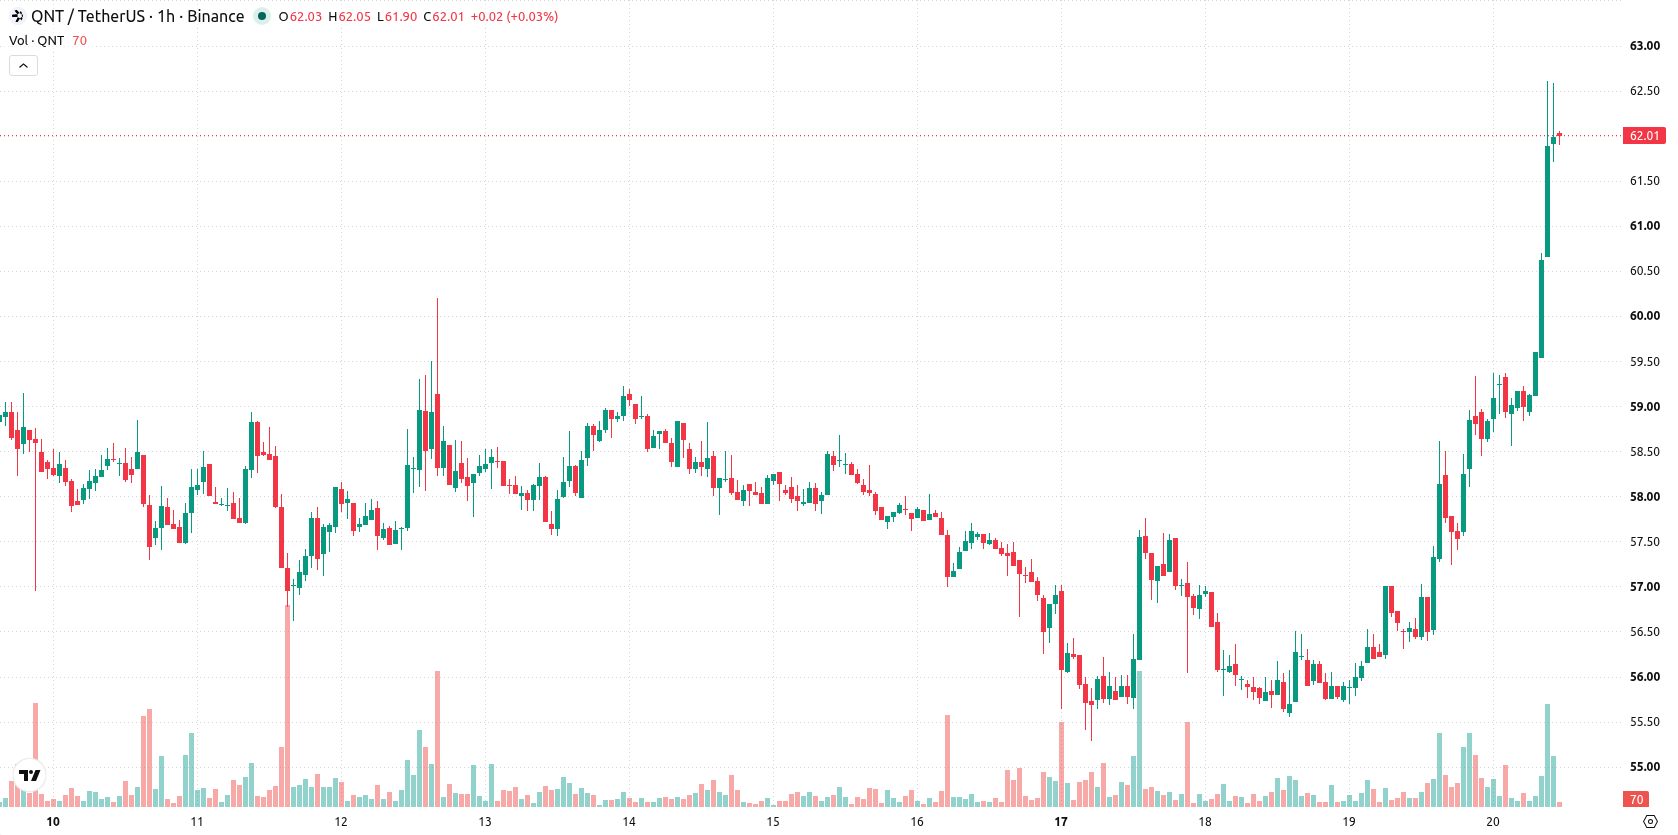
Quant (QNT) is trading at $61.96, posting a strong daily gain of 9.47%. The price is currently positioned above its key short- and medium-term moving averages, while remaining below the long-term average.
 203.86
213.06
Highlights
- QNT/USD is up 9.47% today, holding near session highs and trading above short- and medium-term moving averages.
- Momentum indicators show strong buying strength with overbought conditions, as the price opened with a 2.27 gap and volatility remains elevated.
- Over the next 2 to 3 days, price is expected to trade in a $61.05 to $62.87 range, with a 76% probability of an upward move and immediate support at $59.46.
Overbought signals increase as bullish momentum meets resistance
On the hourly chart, QNT has crossed above the MA-20 and MA-50, but remains capped by the MA-200 on the daily timeframe. Immediate technical support is identified at the Ichimoku Kijun level of $59.46. Momentum indicators reinforce the current trend, with MACD and ADX confirming buying strength and the Awesome Oscillator also supporting the uptrend. Meanwhile, RSI is elevated at 84, and overbought signals are flagged by Stochastic RSI, CCI, and Bull/Bear Power, which shows buyers are dominating intraday activity. However, the overextended nature of these oscillators signals caution for further upside in the near term.
Sideways consolidation likely as breakout and reversal risks emerge
Looking ahead to the next 2–3 trading days, QNT is expected to trade within a range of $61.05 to $62.87. The probability of an upward move stands at 76%, while the likelihood of a downside reversal is 24%. The base case scenario projects sideways consolidation in this corridor, though a breakout above resistance could lead to new short-term highs. Conversely, a sustained move below the immediate support at the Kijun level would confirm a bearish turn.
Earlier, analysts noted that Quant was dominated by persistent bearish pressure and a contained trading range. The latest price action signals a significant shift as bullish momentum drives QNT above key moving averages, making the $59.46 Kijun level a critical support to monitor for near-term trend confirmation.











-
 Afghanistan
-
 Albania
-
 Algeria
-
 Angola
-
 Argentina
-
 Armenia
-
 Australia
-
 Austria
-
 Azerbaijan
-
 Bahamas
-
 Bahrain
-
 Bangladesh
-
 Belarus
-
 Belgium
-
 Bolivia
-
 Botswana
-
 Brazil
-
 Brunei
-
 Bulgaria
-
 Cambodia
-
 Cameroon
-
 Canada
-
 Chile
-
 China
-
 Colombia
-
 Congo
-
 Costa Rica
-
 Cote d'Ivoire
-
 Croatia
-
 Cuba
-
 Cyprus
-
 Czechia
-
 DR Congo
-
 Denmark
-
 Dominican Republic
-
 Ecuador
-
 Egypt
-
 El Salvador
-
 Estonia
-
 Eswatini
-
 Ethiopia
-
 Finland
-
 France
-
 Georgia
-
 Germany
-
 Ghana
-
 Greece
-
 Haiti
-
 Hong Kong
-
 Hungary
-
 India
-
 Indonesia
-
 Iran, Islamic republic
-
 Iraq
-
 Ireland
-
 Israel
-
 Italy
-
 Jamaica
-
 Japan
-
 Jordan
-
 Kazakhstan
-
 Kenya
-
 Korea
-
 Kuwait
-
 Kyrgyzstan
-
 Laos
-
 Latvia
-
 Lebanon
-
 Lesotho
-
 Libya
-
 Lithuania
-
 Luxembourg
-
 Madagascar
-
 Malaysia
-
 Malta
-
 Mauritius
-
 Mexico
-
 Moldova
-
 Mongolia
-
 Montenegro
-
 Morocco
-
 Mozambique
-
 Myanmar
-
 Namibia
-
 Nepal
-
 Netherlands
-
 New Zealand
-
 Nigeria
-
 North Macedonia
-
 Norway
-
 Oman
-
 Pakistan
-
 Palestine
-
 Panama
-
 Papua New Guinea
-
 Paraguay
-
 Peru
-
 Philippines
-
 Poland
-
 Portugal
-
 Puerto Rico
-
 Qatar
-
 Reunion
-
 Romania
-
 Rwanda
-
 Saudi Arabia
-
 Serbia
-
 Singapore
-
 Slovakia
-
 Slovenia
-
 Somalia
-
 South Africa
-
 Spain
-
 Sri Lanka
-
 Sweden
-
 Switzerland
-
 Syria
-
 Taiwan
-
 Tajikistan
-
 Tanzania
-
 Thailand
-
 Trinidad and Tobago
-
 Tunisia
-
 Turkey
-
 UAE
-
 Uganda
-
 Ukraine
-
 United Kingdom
-
United States
-
 Uruguay
-
 Uzbekistan
-
 Venezuela
-
 Vietnam
-
 Yemen
-
 Zambia
-
 Zimbabwe
- Forex
- Crypto












