

The Graph climbs almost 11% as technical momentum fuels rally

The Graph (GRT) surged 10.88% as technical momentum and buying pressure dominated the session. The rally looks limited, with GRT still trading well below its 200-day moving average and facing overhead resistance in the broader bearish structure.
 0.01623
0.01898000
Highlights
- GRT/USD trades above short- and medium-term moving averages but stays well below its longer-term trend level.
- Momentum indicators are mixed with overbought short-term readings and intraday buyers dominant despite lingering medium-term weakness.
- Expected range for the next five sessions is $0.014975 to $0.017025, with a 52% probability of a downward move and a baseline sideways scenario.
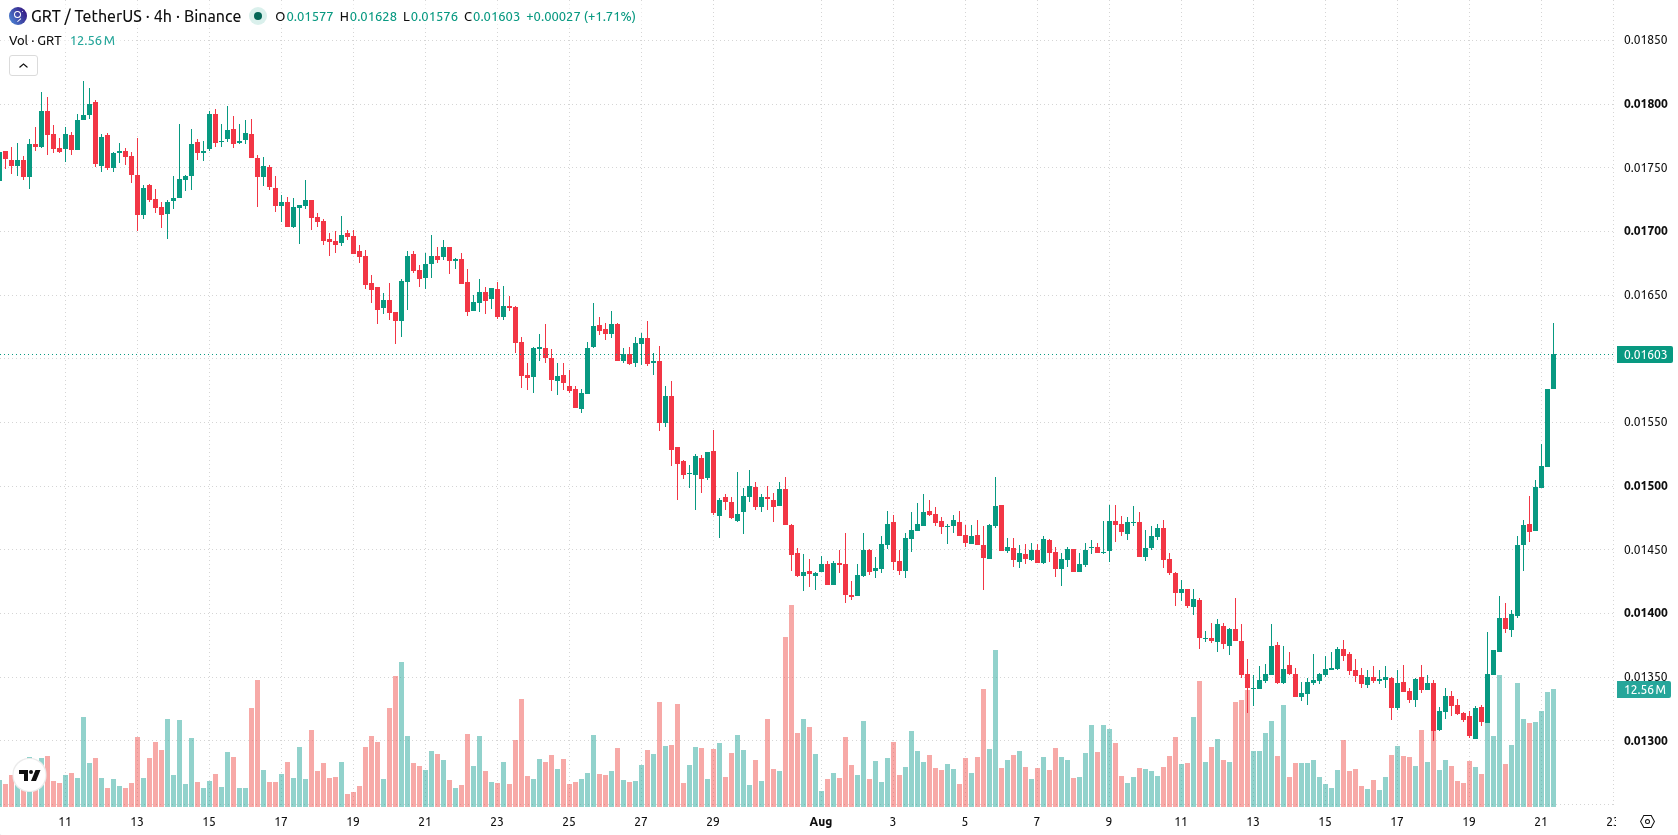
Mixed bullish signals as GRT tests resistance amid bearish trend
GRT/USD is currently trading above the 20-day moving average at $0.014088 and above the 50-day moving average at $0.0157904, but remains well below the 200-day average at $0.02242045. This short- and medium-term structure favors buyers, with recent price action finding support near the Ichimoku Kijun at $0.01468. However, the longer-term trend alignment is bearish. The immediate focus is on resistance at $0.017025 and a floor at $0.01597. Momentum readings are mixed: the Moving Average Convergence Divergence (MACD) signals strong selling pressure, and the Average Directional Index (ADX) also leans bearish. Relative Strength Index (RSI) at 54.93 and Commodity Channel Index (CCI) at 70.62 both suggest underlying bullish momentum. The Stochastic RSI is maxed at 100, indicating strongly overbought conditions. Bull/Bear Power (BBP) is positive at 0.0010557, confirming buyers are intraday dominant. The daily session showed an upside gap of 3.88% followed by a $0.00157, or 10.88%, advance. GRT/USD is now near the high end of its session range as intraday volatility stands at 6.54%. The tone is strong toward the highs, but momentum signals are diverging and reveal an ongoing tug-of-war between renewed buying and persistent medium-term headwinds.
Earlier, analysts noted that The Graph was exhibiting short-term bullish momentum while still contending with longer-term resistance. The latest technical signals present a more mixed outlook, highlighting a consolidation phase with volatility elevated and a potential shift in direction hinging on a confirmed breakout above resistance or a drop below key support.











-
 Afghanistan
-
 Albania
-
 Algeria
-
 Angola
-
 Argentina
-
 Armenia
-
 Australia
-
 Austria
-
 Azerbaijan
-
 Bahamas
-
 Bahrain
-
 Bangladesh
-
 Belarus
-
 Belgium
-
 Bolivia
-
 Botswana
-
 Brazil
-
 Brunei
-
 Bulgaria
-
 Cambodia
-
 Cameroon
-
 Canada
-
 Chile
-
 China
-
 Colombia
-
 Congo
-
 Costa Rica
-
 Cote d'Ivoire
-
 Croatia
-
 Cuba
-
 Cyprus
-
 Czechia
-
 DR Congo
-
 Denmark
-
 Dominican Republic
-
 Ecuador
-
 Egypt
-
 El Salvador
-
 Estonia
-
 Eswatini
-
 Ethiopia
-
 Finland
-
 France
-
 Georgia
-
 Germany
-
 Ghana
-
 Greece
-
 Haiti
-
 Hong Kong
-
 Hungary
-
 India
-
 Indonesia
-
 Iran, Islamic republic
-
 Iraq
-
 Ireland
-
 Israel
-
 Italy
-
 Jamaica
-
 Japan
-
 Jordan
-
 Kazakhstan
-
 Kenya
-
 Korea
-
 Kuwait
-
 Kyrgyzstan
-
 Laos
-
 Latvia
-
 Lebanon
-
 Lesotho
-
 Libya
-
 Lithuania
-
 Luxembourg
-
 Madagascar
-
 Malaysia
-
 Malta
-
 Mauritius
-
 Mexico
-
 Moldova
-
 Mongolia
-
 Montenegro
-
 Morocco
-
 Mozambique
-
 Myanmar
-
 Namibia
-
 Nepal
-
 Netherlands
-
 New Zealand
-
 Nigeria
-
 North Macedonia
-
 Norway
-
 Oman
-
 Pakistan
-
 Palestine
-
 Panama
-
 Papua New Guinea
-
 Paraguay
-
 Peru
-
 Philippines
-
 Poland
-
 Portugal
-
 Puerto Rico
-
 Qatar
-
 Reunion
-
 Romania
-
 Rwanda
-
 Saudi Arabia
-
 Serbia
-
 Singapore
-
 Slovakia
-
 Slovenia
-
 Somalia
-
 South Africa
-
 Spain
-
 Sri Lanka
-
 Sweden
-
 Switzerland
-
 Syria
-
 Taiwan
-
 Tajikistan
-
 Tanzania
-
 Thailand
-
 Trinidad and Tobago
-
 Tunisia
-
 Turkey
-
 UAE
-
 Uganda
-
 Ukraine
-
 United Kingdom
-
United States
-
 Uruguay
-
 Uzbekistan
-
 Venezuela
-
 Vietnam
-
 Yemen
-
 Zambia
-
 Zimbabwe
- Forex
- Crypto












