

VeChain falls nearly 9% as overbought momentum fades and selling pressure rises

VeChain (VET) slid 8.77% on the day as overbought technical momentum faded and selling pressure intensified. The downturn is reinforced by VET remaining below its long-term moving average, even as shorter-term signals show pockets of bullish momentum.
 0.00808
0.00888000
0.00808
0.00888000
Highlights
- VET/USD trades above its 20-day and 50-day moving averages but remains below the 200-day average, indicating bullish short-term momentum and bearish long-term alignment.
- Momentum indicators are mixed, with buy signals from MACD and RSI but overbought signals from Stochastic RSI and CCI, suggesting elevated risk of a near-term pullback.
- Price stands at $0.005386, with a projected 5-day range of $0.0044785 to $0.006779 and a 77% probability of an upward move.
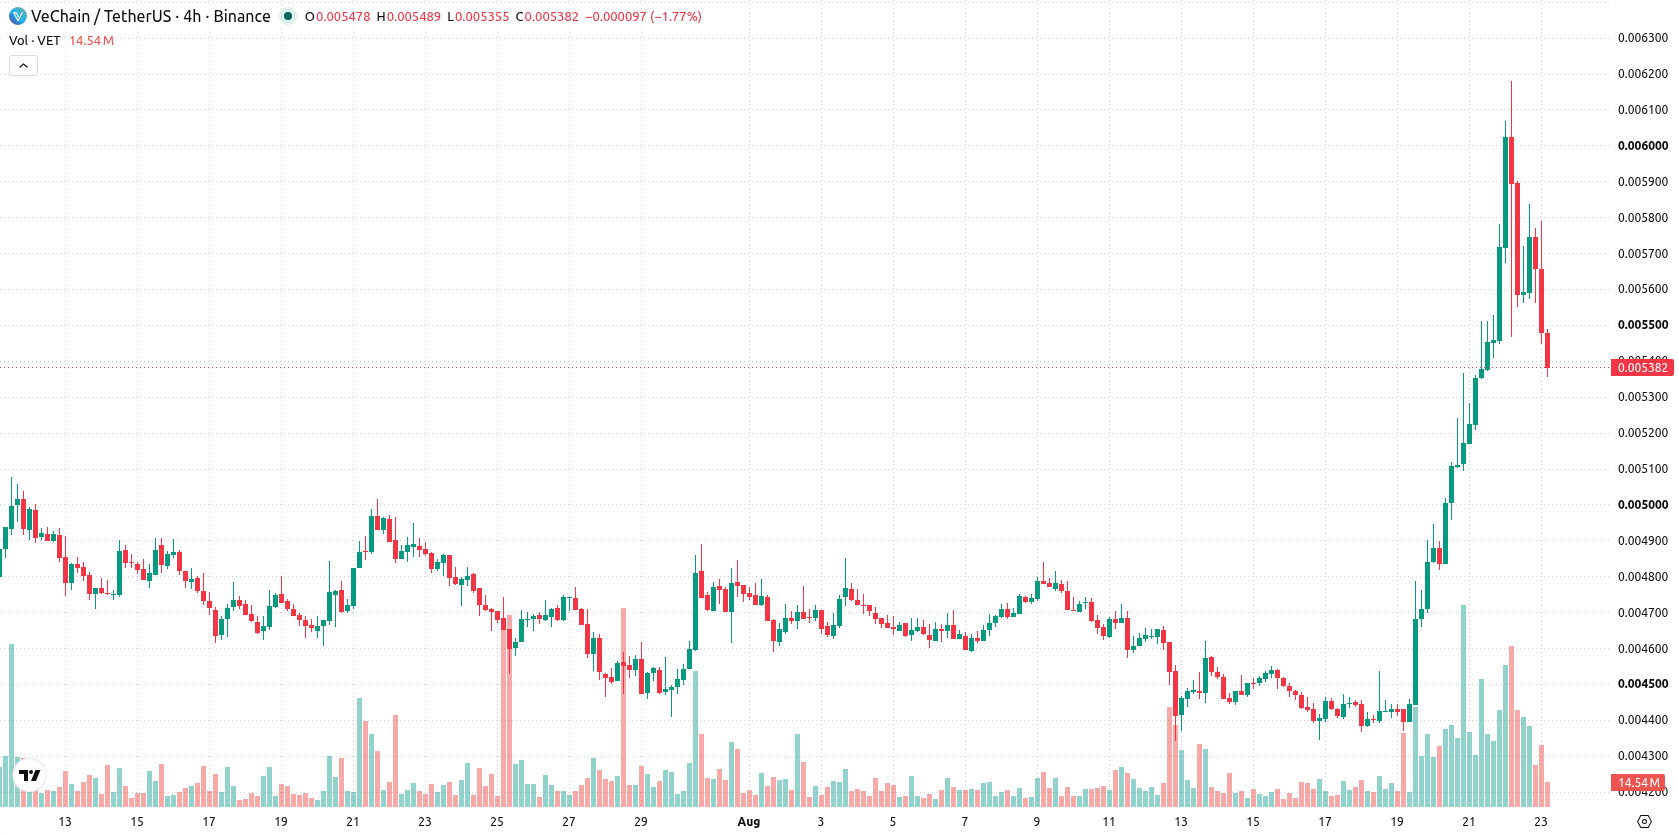
Short-term bullish structure meets mixed signals and overbought risk
VET/USD is trading above both the 20-day and 50-day moving averages ($0.0047502 and $0.00474948), but below the 200-day moving average at $0.0062201. This highlights continued short- and medium-term bullish alignment, but a weak long-term structure. The Ichimoku Kijun at $0.00526 offers near-term structural support, with resistance set at $0.005521. Momentum readings are mixed: MACD signals a buy, but ADX suggests the trend is weak. RSI is elevated at 79.94, supporting a buy bias, as both Stochastic RSI and CCI are deeply overbought, presenting short-term pullback risk. Bull/Bear Power at 0.00120337 shows intraday buyer dominance, though the Awesome Oscillator remains neutral. The price is near the session low with intraday volatility at 4.87%. Overbought momentum contrasts with today's retreat, raising the probability of further cooling in the near term.
Earlier, analysts noted that VeChain’s technical setup favored sideways consolidation with potential upside if resistance was cleared. The current analysis adds that while long-term structure remains weak, traders should closely monitor a break of $0.005521 for signals of directional momentum in the days ahead.










-
 Afghanistan
-
 Albania
-
 Algeria
-
 Angola
-
 Argentina
-
 Armenia
-
 Australia
-
 Austria
-
 Azerbaijan
-
 Bahamas
-
 Bahrain
-
 Bangladesh
-
 Belarus
-
 Belgium
-
 Bolivia
-
 Botswana
-
 Brazil
-
 Brunei
-
 Bulgaria
-
 Cambodia
-
 Cameroon
-
 Canada
-
 Chile
Chile
-
 China
China
-
 Colombia
-
 Congo
Congo
-
 Costa Rica
-
 Cote d'Ivoire
-
 Croatia
-
 Cuba
Cuba
-
 Cyprus
-
 Czechia
-
 DR Congo
-
 Denmark
-
 Dominican Republic
-
 Ecuador
-
 Egypt
Egypt
-
 El Salvador
-
 Estonia
-
 Eswatini
-
 Ethiopia
-
 Finland
-
 France
-
 Georgia
-
 Germany
-
 Ghana
Ghana
-
 Greece
-
 Haiti
Haiti
-
 Hong Kong
-
 Hungary
-
 India
India
-
 Indonesia
-
 Iran, Islamic republic
-
 Iraq
Iraq
-
 Ireland
-
 Israel
-
 Italy
Italy
-
 Jamaica
-
 Japan
Japan
-
 Jordan
-
 Kazakhstan
-
 Kenya
Kenya
-
 Korea
Korea
-
 Kuwait
-
 Kyrgyzstan
-
 Laos
Laos
-
 Latvia
-
 Lebanon
-
 Lesotho
-
 Libya
Libya
-
 Lithuania
-
 Luxembourg
-
 Madagascar
-
 Malaysia
-
 Malta
Malta
-
 Mauritius
-
 Mexico
-
 Moldova
-
 Mongolia
-
 Montenegro
-
 Morocco
-
 Mozambique
-
 Myanmar
-
 Namibia
-
 Nepal
Nepal
-
 Netherlands
-
 New Zealand
-
 Nigeria
-
 North Macedonia
-
 Norway
-
 Oman
Oman
-
 Pakistan
-
 Palestine
-
 Panama
-
 Papua New Guinea
-
 Paraguay
-
 Peru
Peru
-
 Philippines
-
 Poland
-
 Portugal
-
 Puerto Rico
-
 Qatar
Qatar
-
 Reunion
-
 Romania
-
 Rwanda
-
 Saudi Arabia
-
 Serbia
-
 Singapore
-
 Slovakia
-
 Slovenia
-
 Somalia
-
 South Africa
-
 Spain
Spain
-
 Sri Lanka
-
 Sweden
-
 Switzerland
-
 Syria
Syria
-
 Taiwan
-
 Tajikistan
-
 Tanzania
-
 Thailand
-
 Trinidad and Tobago
-
 Tunisia
-
 Turkey
-
 UAE
UAE
-
 Uganda
-
 Ukraine
-
 United Kingdom
-
United States
-
 Uruguay
-
 Uzbekistan
-
 Venezuela
-
 Vietnam
-
 Yemen
Yemen
-
 Zambia
-
 Zimbabwe
- Forex
- Crypto












