

Quant support comes into focus as sellers maintain pressure: weekly analysis

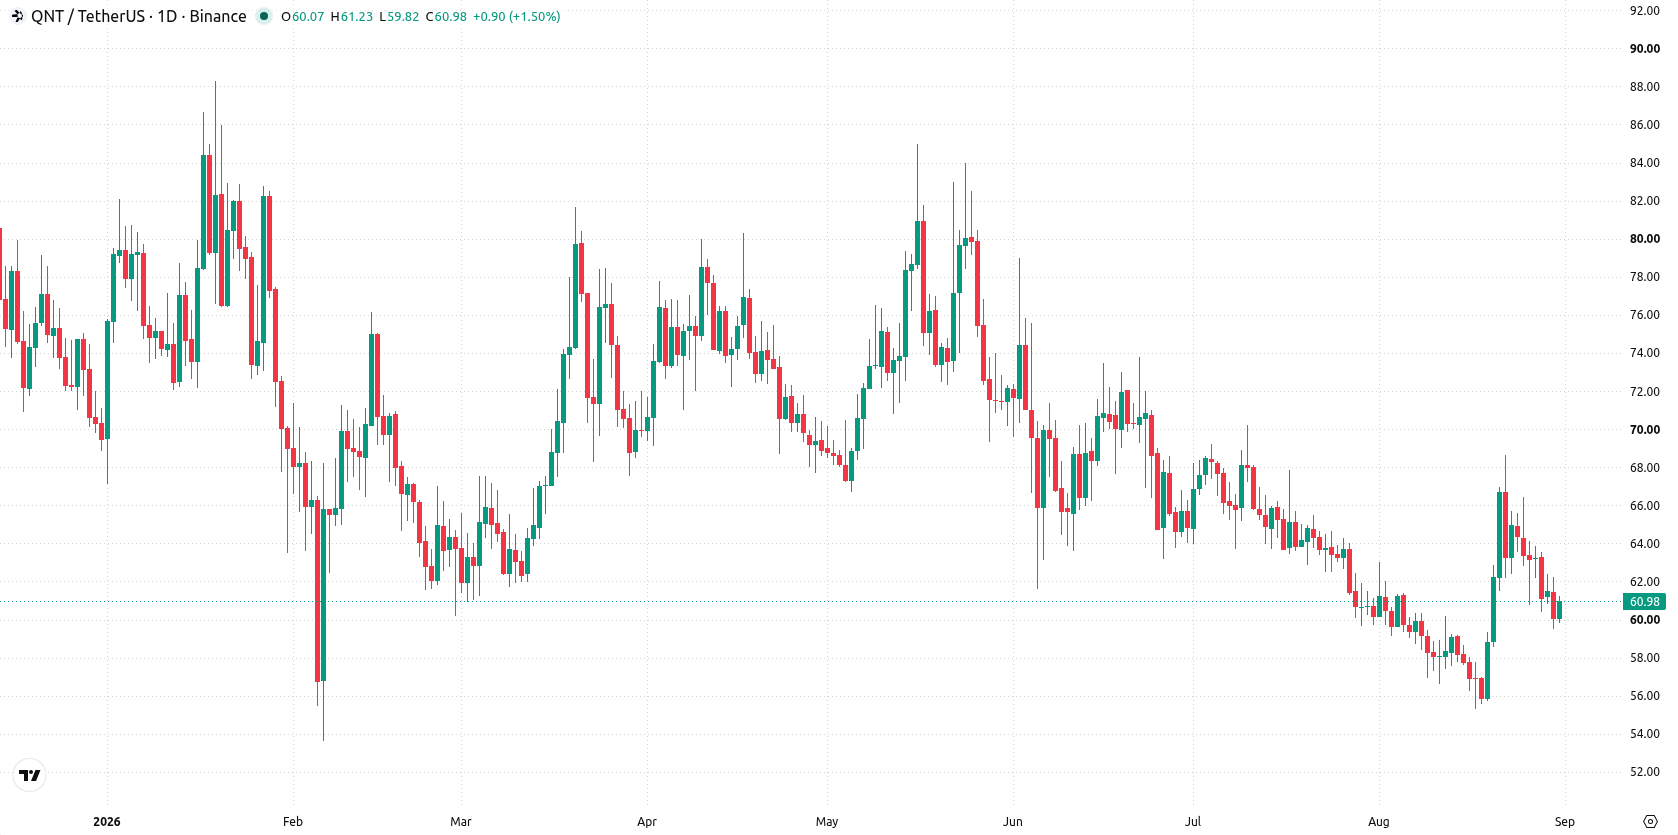
Quant (QNT) is trading near $61 after a nearly 4% slide this week, as bulls and bears struggle for control around key support. The chart reveals a tense standoff — high volatility but flat overall direction — and conflicting momentum signals keep market momentum muted. The week ahead will likely be decided by whether sellers can maintain dominance or support can trigger a shift in tone.
 203.49
223.960000
Highlights
- Quant trades at $60.98, falling 4.36% over the past week and holding immediate support at $60.781.
- Price action remains below key moving averages with a bearish structure as sellers retain control amid weak trend strength.
- Expected trading range for the week is $56.65 to $64.636428 with a 68% probability of a decrease.
Volatility rises but trend signals diverge over the week
On the daily chart, the move lower has been sharp but has not led to a sustained directional trend, as trend strength remains flat despite volatility at 11.61%. MACD signals a buy with a value of 0.566839, yet Bull/Bear Power shows an oversold reading, highlighting a conflict in momentum signals and reflecting underlying uncertainty. The price is holding immediate support at $60.781, with resistance at the 50-day average near $61.6434, and the Ichimoku Kijun at $61.95 also acting as resistance. This positioning leaves Quant caught between key levels as sellers remain in control.
Downside risk prevails as consolidation range narrows next week
In the week ahead, the expected range is $56.65 to $64.636428, with a 32% probability of an increase and a 68% probability of a decrease. The base case sees the pair consolidating between support at $60.781 and resistance at $61.6434. A sustained move above $61.6434 could open the way to test $64.636428, while a drop below $60.781 would likely see bears target the $56.65 area.
Earlier, analysts noted that Quant was caught between mixed technical signals, with consolidation favored unless a decisive move occurred. The latest price action reinforces this sideways scenario, and traders should watch for a clear break above $61.95 or below $60.781 to signal the next directional move.











-
 Afghanistan
-
 Albania
-
 Algeria
-
 Angola
-
 Argentina
-
 Armenia
-
 Australia
-
 Austria
-
 Azerbaijan
-
 Bahamas
-
 Bahrain
-
 Bangladesh
-
 Belarus
-
 Belgium
-
 Bolivia
-
 Botswana
-
 Brazil
-
 Brunei
-
 Bulgaria
-
 Cambodia
-
 Cameroon
-
 Canada
-
 Chile
-
 China
-
 Colombia
-
 Congo
-
 Costa Rica
-
 Cote d'Ivoire
-
 Croatia
-
 Cuba
-
 Cyprus
-
 Czechia
-
 DR Congo
-
 Denmark
-
 Dominican Republic
-
 Ecuador
-
 Egypt
-
 El Salvador
-
 Estonia
-
 Eswatini
-
 Ethiopia
-
 Finland
-
 France
-
 Georgia
-
 Germany
-
 Ghana
-
 Greece
-
 Haiti
-
 Hong Kong
-
 Hungary
-
 India
-
 Indonesia
-
 Iran, Islamic republic
-
 Iraq
-
 Ireland
-
 Israel
-
 Italy
-
 Jamaica
-
 Japan
-
 Jordan
-
 Kazakhstan
-
 Kenya
-
 Korea
-
 Kuwait
-
 Kyrgyzstan
-
 Laos
-
 Latvia
-
 Lebanon
-
 Lesotho
-
 Libya
-
 Lithuania
-
 Luxembourg
-
 Madagascar
-
 Malaysia
-
 Malta
-
 Mauritius
-
 Mexico
-
 Moldova
-
 Mongolia
-
 Montenegro
-
 Morocco
-
 Mozambique
-
 Myanmar
-
 Namibia
-
 Nepal
-
 Netherlands
-
 New Zealand
-
 Nigeria
-
 North Macedonia
-
 Norway
-
 Oman
-
 Pakistan
-
 Palestine
-
 Panama
-
 Papua New Guinea
-
 Paraguay
-
 Peru
-
 Philippines
-
 Poland
-
 Portugal
-
 Puerto Rico
-
 Qatar
-
 Reunion
-
 Romania
-
 Rwanda
-
 Saudi Arabia
-
 Serbia
-
 Singapore
-
 Slovakia
-
 Slovenia
-
 Somalia
-
 South Africa
-
 Spain
-
 Sri Lanka
-
 Sweden
-
 Switzerland
-
 Syria
-
 Taiwan
-
 Tajikistan
-
 Tanzania
-
 Thailand
-
 Trinidad and Tobago
-
 Tunisia
-
 Turkey
-
 UAE
-
 Uganda
-
 Ukraine
-
 United Kingdom
-
United States
-
 Uruguay
-
 Uzbekistan
-
 Venezuela
-
 Vietnam
-
 Yemen
-
 Zambia
-
 Zimbabwe
- Forex
- Crypto












