

Quant extends rally by around 14% as volatility rises and consolidation risk mounts: weekly analysis

Quant (QNT) is trading near $64 after a strong surge of around 14% over the past week, with bulls driving prices higher but key technical signals showing some hesitation. The sharp rally has pushed momentum indicators into overbought territory, raising questions about how sustainable this upswing is as the market enters a new week. Mixed signals across the chart suggest traders face a tug-of-war between stretched momentum and the potential for consolidation.
 203.49
223.960000
Highlights
- Quant rose 14.16% over the past 7 days to $63.91, trading above short-term moving averages but below long-term resistance.
- Technical indicators are mixed with increasing volatility and overbought momentum signals, suggesting short-term exhaustion after the recent rapid price gain.
- Expected range for the next 7 days is $56.99 to $70.83, with consolidation likely unless key resistance at $68.37 is breached.
Muted sentiment shifts as no new tokenomics or regulatory catalysts emerge
Quant is an ERC-20 token on the Ethereum blockchain serving both as a means of exchange and for governance on its platform, co-founded by Gilbert Verdian and Dr. Paolo Tasca. The platform operates under proof-of-stake and proof-of-activity mechanisms, with continued community participation in network governance. No material updates on tokenomics, regulatory actions, or technology upgrades were confirmed for the week ahead, according to Daily Political.
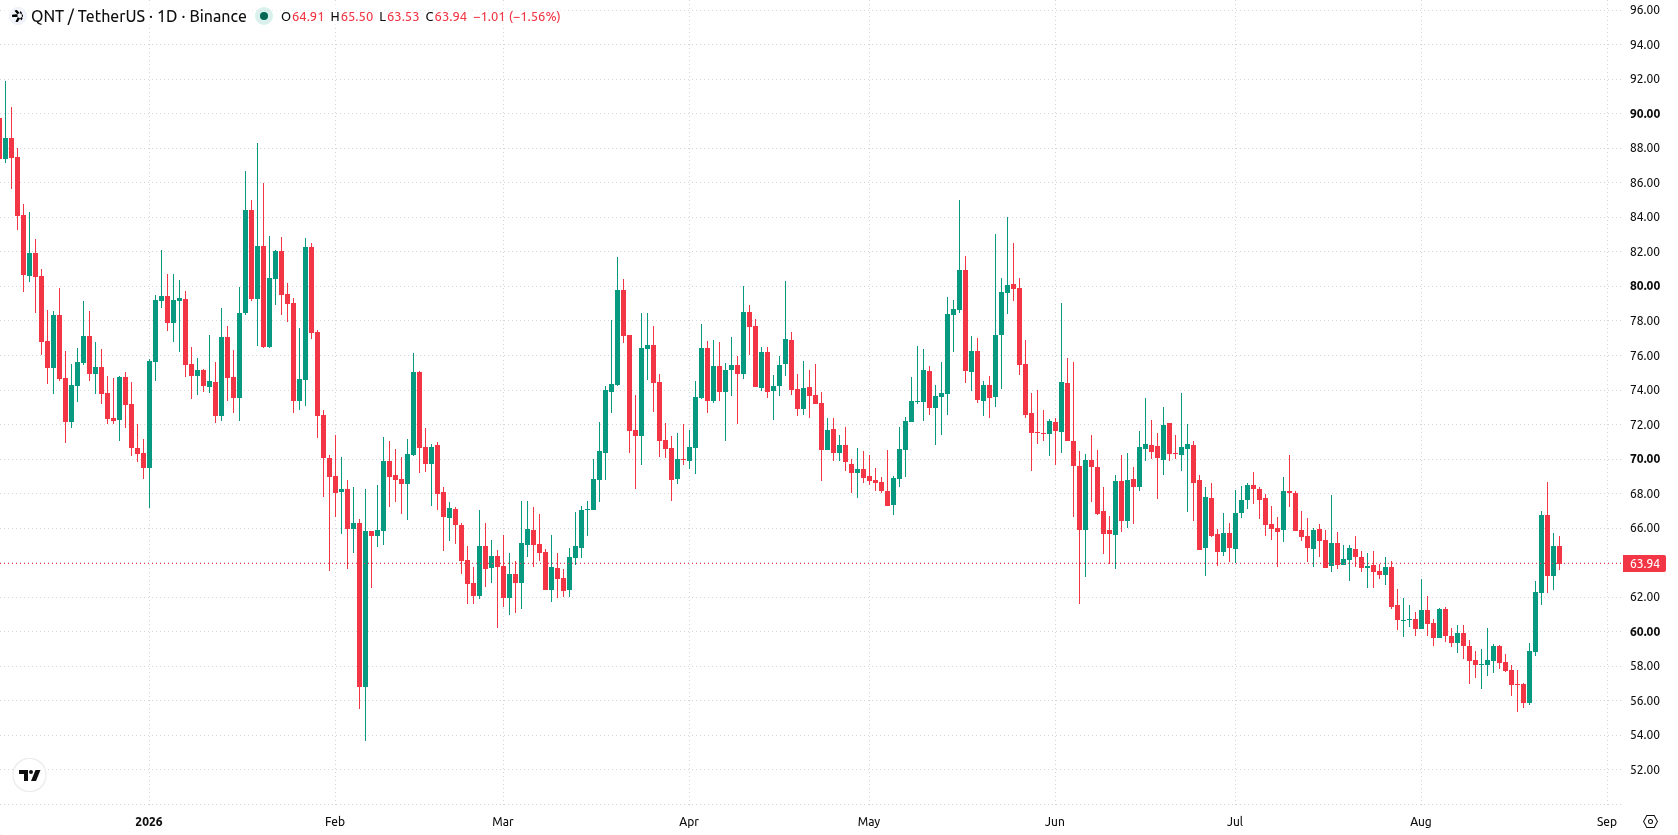
Overbought technicals as sharp weekly volatility sparks consolidation risk
On the daily chart, the structure reflects a sharp move higher without a sustained trend, as volatility over the past week has reached 23.53%. Momentum indicators are mixed, with RSI in the neutral zone at 59.54 but CCI entering overbought territory at 149.38, and Bull/Bear Power also registers in the overbought region. Support is marked at $62.1666 (MA-50) and reinforced by the Ichimoku Kijun at $61.95, while resistance stands at $68.36875 (MA-200). These technical signals suggest the price may consolidate after the recent swift gain, but overbought readings highlight potential short-term exhaustion.
Range-bound outlook as consolidation expected unless resistance breaks
For the next 7 days, the expected range is $56.994006 to $70.825993, with probabilities tilted 53% toward an increase and 47% toward a decrease. The base case is further consolidation within this band, anchored by MA-50 and the Kijun near $62. Resistance at $68.36875 marks the threshold for a potential bullish extension above the 200-day average. Alternatively, a break below MA-50 support could see the pair retest lower levels in the range.
Earlier, analysts noted that Quant was transitioning from persistent bearish pressure to a renewed bullish momentum, with technical signals supporting potential further upside. The latest developments reinforce this directional shift and suggest that traders should monitor the $68.37 resistance level for a possible breakout or signs of short-term exhaustion given the overbought conditions.











-
 Afghanistan
-
 Albania
-
 Algeria
-
 Angola
-
 Argentina
-
 Armenia
-
 Australia
-
 Austria
-
 Azerbaijan
-
 Bahamas
-
 Bahrain
-
 Bangladesh
-
 Belarus
-
 Belgium
-
 Bolivia
-
 Botswana
-
 Brazil
-
 Brunei
-
 Bulgaria
-
 Cambodia
-
 Cameroon
-
 Canada
-
 Chile
-
 China
-
 Colombia
-
 Congo
-
 Costa Rica
-
 Cote d'Ivoire
-
 Croatia
-
 Cuba
-
 Cyprus
-
 Czechia
-
 DR Congo
-
 Denmark
-
 Dominican Republic
-
 Ecuador
-
 Egypt
-
 El Salvador
-
 Estonia
-
 Eswatini
-
 Ethiopia
-
 Finland
-
 France
-
 Georgia
-
 Germany
-
 Ghana
-
 Greece
-
 Haiti
-
 Hong Kong
-
 Hungary
-
 India
-
 Indonesia
-
 Iran, Islamic republic
-
 Iraq
-
 Ireland
-
 Israel
-
 Italy
-
 Jamaica
-
 Japan
-
 Jordan
-
 Kazakhstan
-
 Kenya
-
 Korea
-
 Kuwait
-
 Kyrgyzstan
-
 Laos
-
 Latvia
-
 Lebanon
-
 Lesotho
-
 Libya
-
 Lithuania
-
 Luxembourg
-
 Madagascar
-
 Malaysia
-
 Malta
-
 Mauritius
-
 Mexico
-
 Moldova
-
 Mongolia
-
 Montenegro
-
 Morocco
-
 Mozambique
-
 Myanmar
-
 Namibia
-
 Nepal
-
 Netherlands
-
 New Zealand
-
 Nigeria
-
 North Macedonia
-
 Norway
-
 Oman
-
 Pakistan
-
 Palestine
-
 Panama
-
 Papua New Guinea
-
 Paraguay
-
 Peru
-
 Philippines
-
 Poland
-
 Portugal
-
 Puerto Rico
-
 Qatar
-
 Reunion
-
 Romania
-
 Rwanda
-
 Saudi Arabia
-
 Serbia
-
 Singapore
-
 Slovakia
-
 Slovenia
-
 Somalia
-
 South Africa
-
 Spain
-
 Sri Lanka
-
 Sweden
-
 Switzerland
-
 Syria
-
 Taiwan
-
 Tajikistan
-
 Tanzania
-
 Thailand
-
 Trinidad and Tobago
-
 Tunisia
-
 Turkey
-
 UAE
-
 Uganda
-
 Ukraine
-
 United Kingdom
-
United States
-
 Uruguay
-
 Uzbekistan
-
 Venezuela
-
 Vietnam
-
 Yemen
-
 Zambia
-
 Zimbabwe
- Forex
- Crypto












