

Quant technical analysis: Breakout attempt at $68.35 resistance

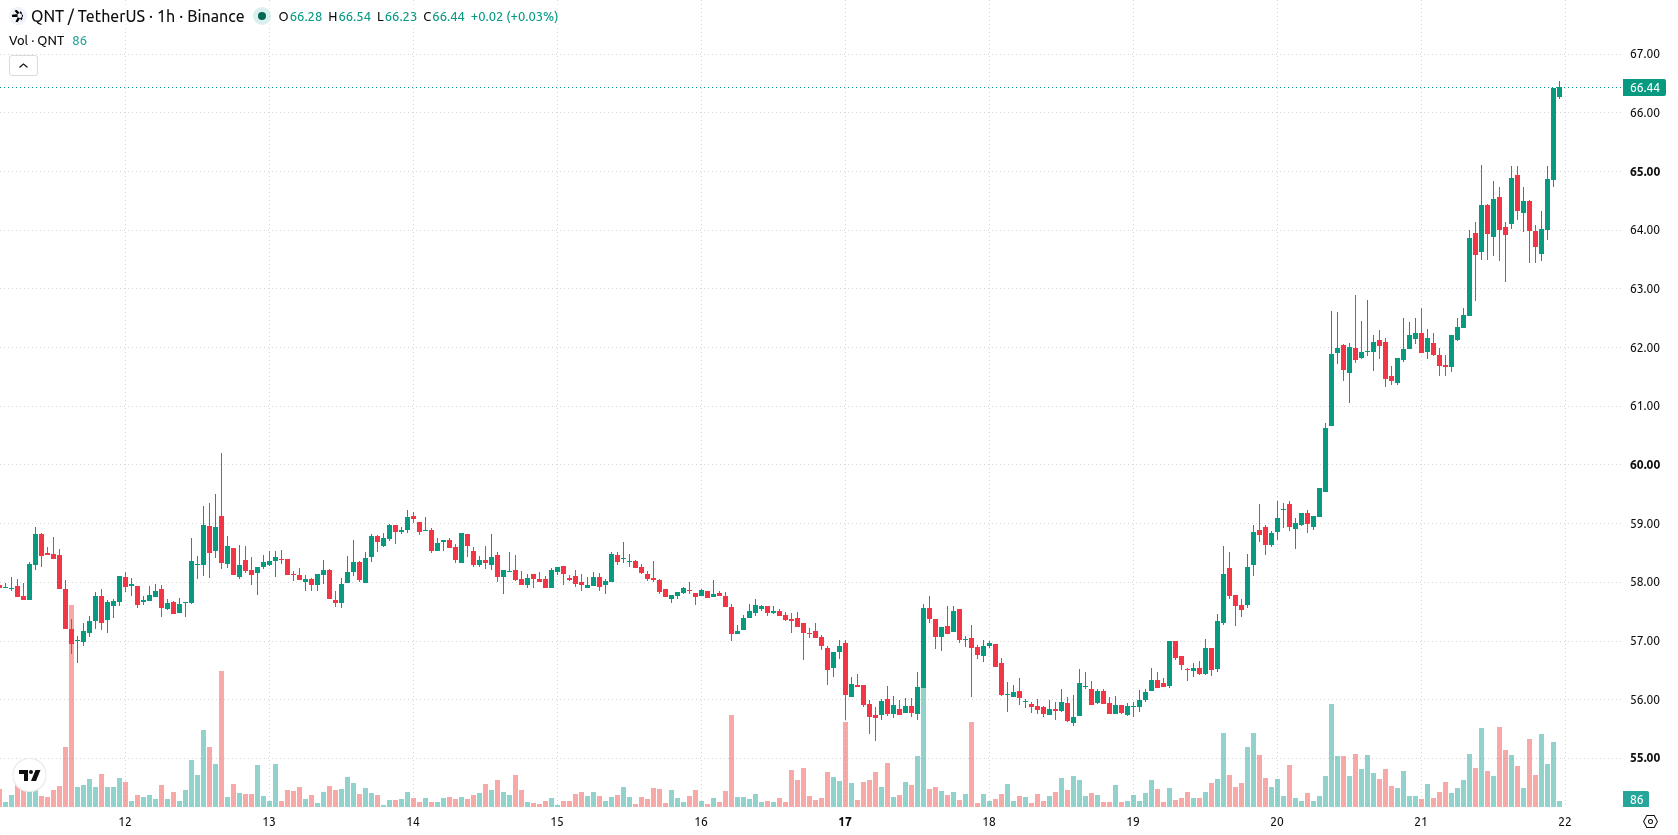
Quant (QNT) is trading at $66.51, climbing 7.03% on the day with a strong upward move. The asset is situated above its key short- and medium-term moving averages, while remaining below the long-term average.
 203.86
213.06
Highlights
- QNT trades with short- and medium-term bullish momentum but faces resistance below the long-term trend level.
- Most momentum indicators show strong buyer interest with some overbought readings, raising potential for short-term pause.
- QNT is expected to range between $64.808352 and $68.211648 over the next 2 to 3 days, with continued upside favored.
Momentum signals strengthen as price nears long-term resistance
On the technical front, QNT is trading above the MA-20 at $63.71 and the MA-50 at $61.97 on the hourly chart, reflecting active bullish momentum over short and medium terms. The price remains capped by the MA-200 overhead at $68.35, with the Ichimoku Kijun line at $63.41 providing the nearest support. Momentum indicators show MACD in Strong Buy territory and ADX confirming robust buying pressure. RSI stands elevated at 67.70 (Buy), while CCI signals overbought conditions; Stoch RSI is Neutral, suggesting some moderation in upside pace. Bull/Bear Power confirms a strong buyer bias intraday, but the Awesome Oscillator is Neutral and does not strongly confirm the move.
Consolidation likely as range caps further upside
In the short term, QNT is likely to consolidate within a typical volatility band of $64.81 to $68.21 over the next two to three trading days. The prevailing scenario is sideways movement inside this corridor, with a very high probability of continued upside if resistance breaks. Should support at the Ichimoku Kijun fail, QNT may be exposed to a deeper pullback, though the chance of a downside move remains very low.
Earlier, analysts noted that Quant was transitioning from a period of persistent bearish pressure to renewed bullish momentum above key moving averages. The latest price action further strengthens this trend shift, with active buying signals and technical support positioning QNT for potential upside if it can break through immediate resistance.











-
 Afghanistan
-
 Albania
-
 Algeria
-
 Angola
-
 Argentina
-
 Armenia
-
 Australia
-
 Austria
-
 Azerbaijan
-
 Bahamas
-
 Bahrain
-
 Bangladesh
-
 Belarus
-
 Belgium
-
 Bolivia
-
 Botswana
-
 Brazil
-
 Brunei
-
 Bulgaria
-
 Cambodia
-
 Cameroon
-
 Canada
-
 Chile
-
 China
-
 Colombia
-
 Congo
-
 Costa Rica
-
 Cote d'Ivoire
-
 Croatia
-
 Cuba
-
 Cyprus
-
 Czechia
-
 DR Congo
-
 Denmark
-
 Dominican Republic
-
 Ecuador
-
 Egypt
-
 El Salvador
-
 Estonia
-
 Eswatini
-
 Ethiopia
-
 Finland
-
 France
-
 Georgia
-
 Germany
-
 Ghana
-
 Greece
-
 Haiti
-
 Hong Kong
-
 Hungary
-
 India
-
 Indonesia
-
 Iran, Islamic republic
-
 Iraq
-
 Ireland
-
 Israel
-
 Italy
-
 Jamaica
-
 Japan
-
 Jordan
-
 Kazakhstan
-
 Kenya
-
 Korea
-
 Kuwait
-
 Kyrgyzstan
-
 Laos
-
 Latvia
-
 Lebanon
-
 Lesotho
-
 Libya
-
 Lithuania
-
 Luxembourg
-
 Madagascar
-
 Malaysia
-
 Malta
-
 Mauritius
-
 Mexico
-
 Moldova
-
 Mongolia
-
 Montenegro
-
 Morocco
-
 Mozambique
-
 Myanmar
-
 Namibia
-
 Nepal
-
 Netherlands
-
 New Zealand
-
 Nigeria
-
 North Macedonia
-
 Norway
-
 Oman
-
 Pakistan
-
 Palestine
-
 Panama
-
 Papua New Guinea
-
 Paraguay
-
 Peru
-
 Philippines
-
 Poland
-
 Portugal
-
 Puerto Rico
-
 Qatar
-
 Reunion
-
 Romania
-
 Rwanda
-
 Saudi Arabia
-
 Serbia
-
 Singapore
-
 Slovakia
-
 Slovenia
-
 Somalia
-
 South Africa
-
 Spain
-
 Sri Lanka
-
 Sweden
-
 Switzerland
-
 Syria
-
 Taiwan
-
 Tajikistan
-
 Tanzania
-
 Thailand
-
 Trinidad and Tobago
-
 Tunisia
-
 Turkey
-
 UAE
-
 Uganda
-
 Ukraine
-
 United Kingdom
-
United States
-
 Uruguay
-
 Uzbekistan
-
 Venezuela
-
 Vietnam
-
 Yemen
-
 Zambia
-
 Zimbabwe
- Forex
- Crypto












