


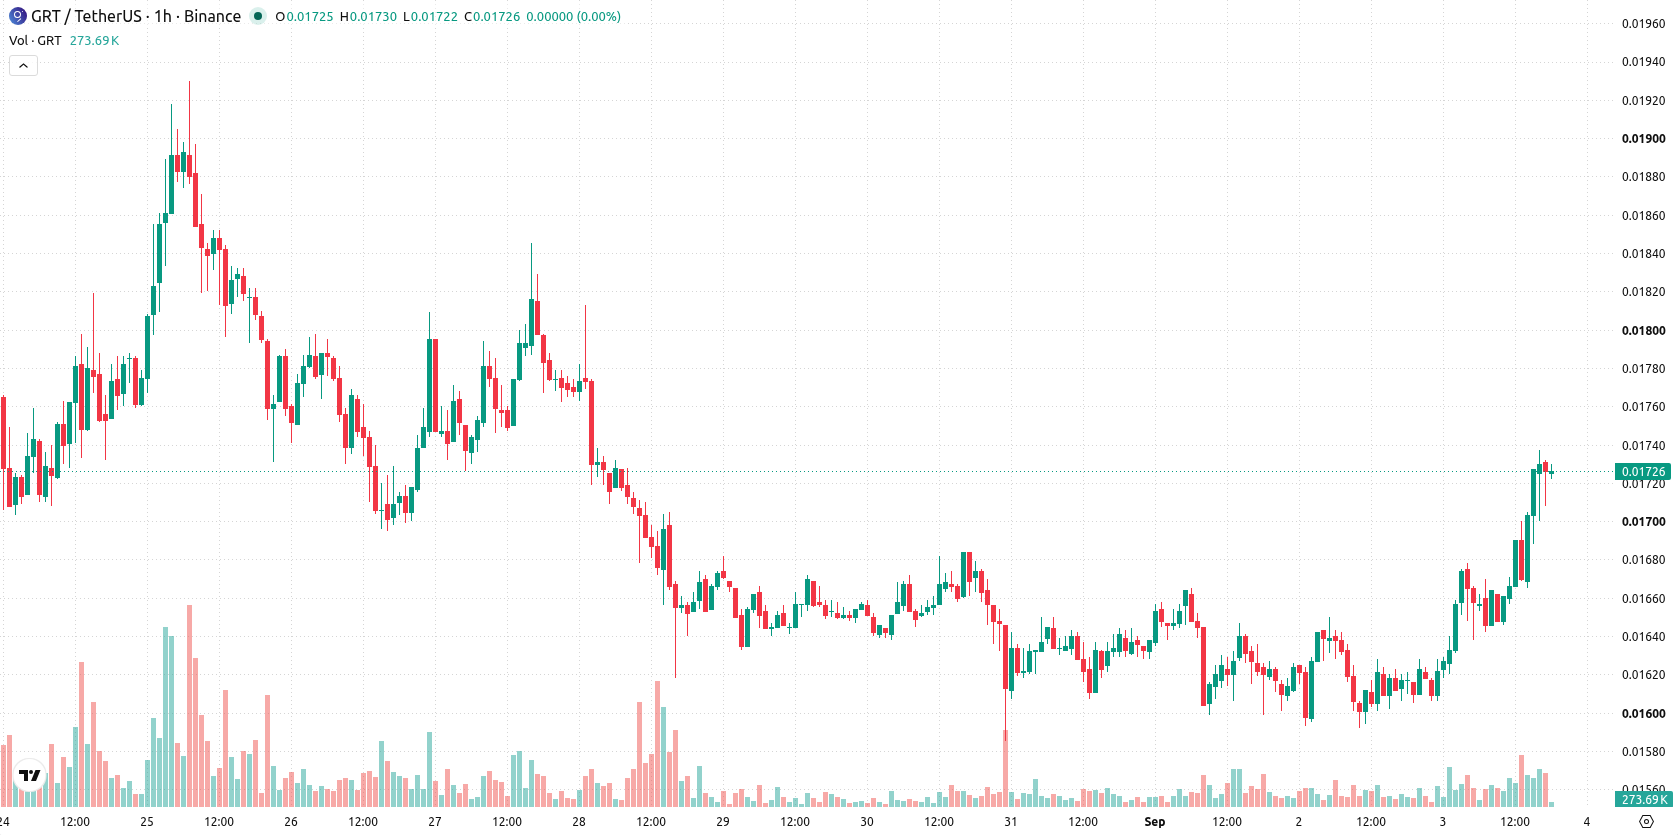
The Graph (GRT) is trading at $0.01726, advancing 6.81% for the session. The asset is positioned above its key short- and medium-term moving averages, but remains below longer-term averages.
 0.02713
0.02922000
0.02713
0.02922000
Highlights
- GRT/USD trades above short- and medium-term averages but stays below its long-term average, reflecting diverging momentum across timeframes.
- Momentum indicators conflict, with some buy and overbought signals pointing to potentially overstretched upward movement short term.
- Price currently at $0.01726, up 6.81% for the session, with a 2–3 day range forecast of $0.01602 to $0.01776982 and up probability at 78%.
Momentum divergence as mixed signals challenge resistance
On the H1 timeframe, GRT/USD is trading above both the MA-20 and MA-50 moving averages, while remaining below the MA-200, highlighting the divergence between shorter-term momentum and longer-term resistance. The Ichimoku Kijun is set at $0.01671 and serves as the nearest support level. Momentum signals show a mixed picture: MACD issues a buy signal, ADX remains neutral, and RSI is elevated at 65.91, suggesting buying pressure. Conversely, Stochastic RSI indicates a strong sell, while CCI is in overbought territory, underlining overextended conditions. Bull/Bear Power confirms intraday buyer dominance, and the Awesome Oscillator supports the net upward direction, with price action occurring near today’s high amid heightened volatility.
Upside bias evident as volatility drives consolidation range
Over the next 2–3 trading days, GRT/USD is most likely to consolidate within the $0.01602 to $0.01776982 range, representing the typical volatility band relative to current levels. With upward movement probability estimated at 78% versus a 22% chance of a downward scenario, risks skew to further gains if resistance is breached. Alternatively, a drop below immediate support could trigger a pullback; otherwise, sideways action is the base case.
Earlier, analysts noted that The Graph was exhibiting resilience within a defined range, with technical signals reflecting balanced but cautious momentum. The current setup reinforces this outlook, and traders should monitor the $0.01671 support as a critical level that could frame the next notable shift in GRT/USD direction.











-
 Afghanistan
-
 Albania
-
 Algeria
-
 Angola
-
 Argentina
-
 Armenia
-
 Australia
-
 Austria
-
 Azerbaijan
-
 Bahamas
-
 Bahrain
-
 Bangladesh
-
 Belarus
-
 Belgium
-
 Bolivia
-
 Botswana
-
 Brazil
-
 Brunei
-
 Bulgaria
-
 Cambodia
-
 Cameroon
-
 Canada
-
 Chile
Chile
-
 China
China
-
 Colombia
-
 Congo
Congo
-
 Costa Rica
-
 Cote d'Ivoire
-
 Croatia
-
 Cuba
Cuba
-
 Cyprus
-
 Czechia
-
 DR Congo
-
 Denmark
-
 Dominican Republic
-
 Ecuador
-
 Egypt
Egypt
-
 El Salvador
-
 Estonia
-
 Eswatini
-
 Ethiopia
-
 Finland
-
 France
-
 Georgia
-
 Germany
-
 Ghana
Ghana
-
 Greece
-
 Haiti
Haiti
-
 Hong Kong
-
 Hungary
-
 India
India
-
 Indonesia
-
 Iran, Islamic republic
-
 Iraq
Iraq
-
 Ireland
-
 Israel
-
 Italy
Italy
-
 Jamaica
-
 Japan
Japan
-
 Jordan
-
 Kazakhstan
-
 Kenya
Kenya
-
 Korea
Korea
-
 Kuwait
-
 Kyrgyzstan
-
 Laos
Laos
-
 Latvia
-
 Lebanon
-
 Lesotho
-
 Libya
Libya
-
 Lithuania
-
 Luxembourg
-
 Madagascar
-
 Malaysia
-
 Malta
Malta
-
 Mauritius
-
 Mexico
-
 Moldova
-
 Mongolia
-
 Montenegro
-
 Morocco
-
 Mozambique
-
 Myanmar
-
 Namibia
-
 Nepal
Nepal
-
 Netherlands
-
 New Zealand
-
 Nigeria
-
 North Macedonia
-
 Norway
-
 Oman
Oman
-
 Pakistan
-
 Palestine
-
 Panama
-
 Papua New Guinea
-
 Paraguay
-
 Peru
Peru
-
 Philippines
-
 Poland
-
 Portugal
-
 Puerto Rico
-
 Qatar
Qatar
-
 Reunion
-
 Romania
-
 Rwanda
-
 Saudi Arabia
-
 Serbia
-
 Singapore
-
 Slovakia
-
 Slovenia
-
 Somalia
-
 South Africa
-
 Spain
Spain
-
 Sri Lanka
-
 Sweden
-
 Switzerland
-
 Syria
Syria
-
 Taiwan
-
 Tajikistan
-
 Tanzania
-
 Thailand
-
 Trinidad and Tobago
-
 Tunisia
-
 Turkey
-
 UAE
UAE
-
 Uganda
-
 Ukraine
-
 United Kingdom
-
United States
-
 Uruguay
-
 Uzbekistan
-
 Venezuela
-
 Vietnam
-
 Yemen
Yemen
-
 Zambia
-
 Zimbabwe
- Forex
- Crypto












