

The Graph faces resistance at $0.0193 with bullish momentum diverging from HMA signal: weekly analysis

The Graph (GRT) is holding near $0.0165 after gaining around 8% over the past week, as technical signals point to a resilient uptrend despite mixed momentum beneath the surface. The interplay between bullish momentum readings and an HMA in sell mode highlights underlying uncertainty, bringing support into focus as traders evaluate the strength of the recent move heading into this week.
 0.02585
0.02844000
0.02585
0.02844000
Highlights
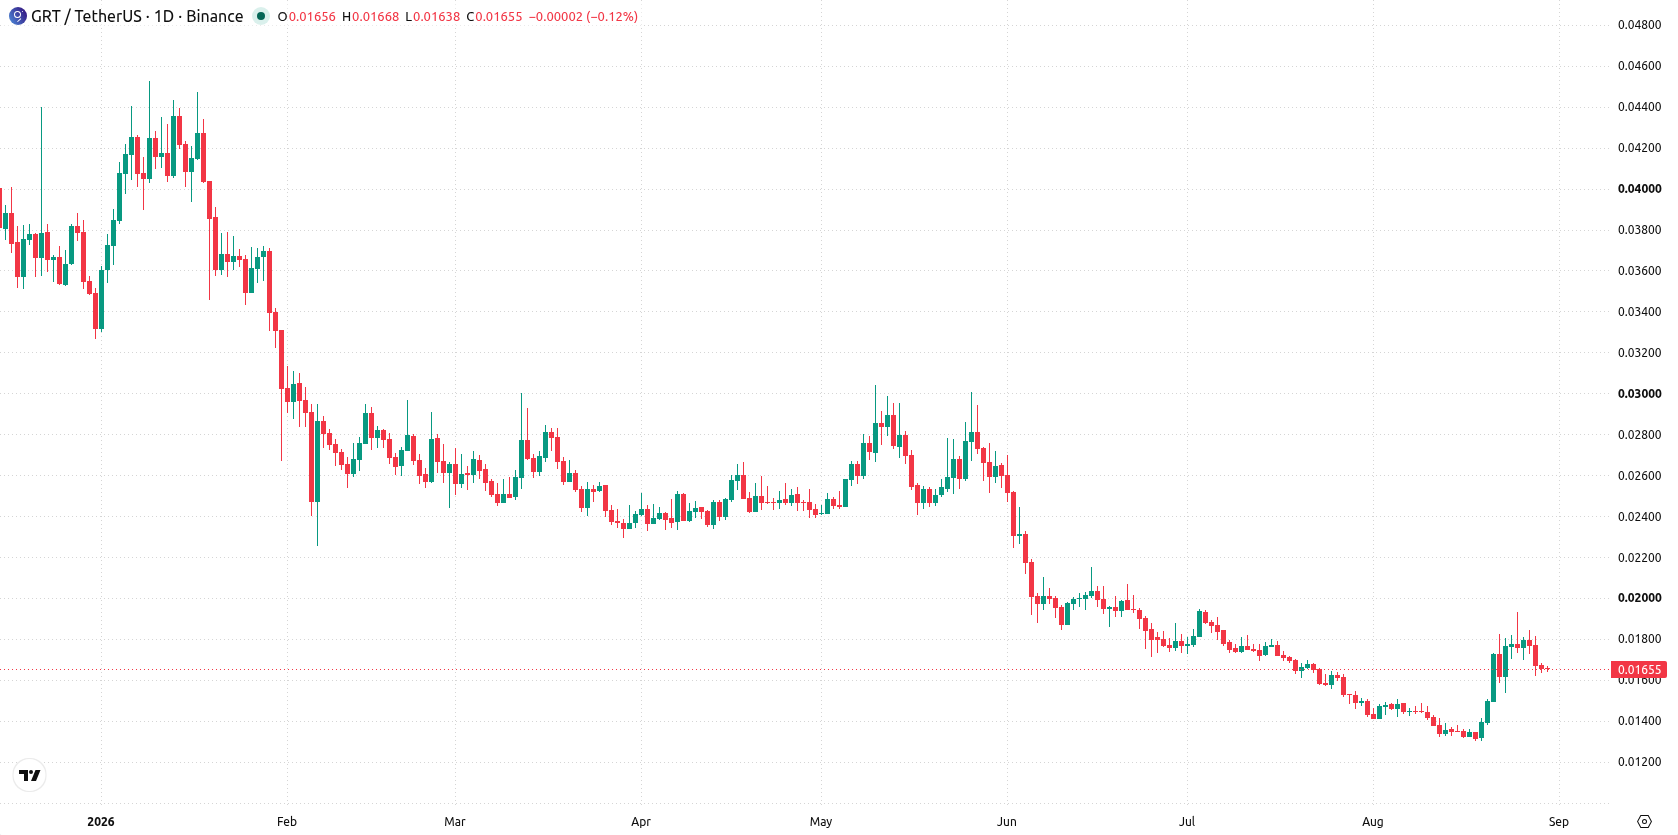
- The Graph is trading at $0.01655, up 7.53% over the past 7 days with bullish short-term momentum.
- The price remains capped by resistance at $0.0193 and supported at $0.01618, framing a defined trading range.
- Indicators register strong upward trend signals, but some divergence persists as trend momentum and volatility remain elevated.
Bullish momentum holds over the week despite HMA divergence
The daily chart shows a sustained move higher with a firm trend, as signaled by strong ADX and Bull/Bear Power readings, while the RSI remains in the neutral zone. Volatility over the past week registered at 19.28%, with price now hovering just above key support at $0.01618 and not far from the Ichimoku Kijun at $0.016145. Resistance sits at $0.0193, defining the upper boundary of the recent range. Momentum signals are generally bullish, but the HMA is in sell mode, pointing to some divergence beneath the surface.
Range-bound outlook expected as support and breakout levels converge
Over the next 7 days, The Graph is expected to trade between $0.01489905 and $0.01820094. The probability of an increase stands at 53%, while the probability of a decrease is 47%. The base case is a continuation of current momentum within this range, with price finding support near $0.01618. A sustained breakout above $0.0193 would turn focus to the upper end of the expected range, while a daily close below $0.01618 would expose the lower boundary.
Earlier, analysts noted that The Graph had returned to bearish dominance after a period of short-term bullish activity. The latest price action introduces a more balanced outlook, with attention now focused on maintaining support near $0.01618 as the critical threshold for trend validation in the coming week.











-
 Afghanistan
-
 Albania
-
 Algeria
-
 Angola
-
 Argentina
-
 Armenia
-
 Australia
-
 Austria
-
 Azerbaijan
-
 Bahamas
-
 Bahrain
-
 Bangladesh
-
 Belarus
-
 Belgium
-
 Bolivia
-
 Botswana
-
 Brazil
-
 Brunei
-
 Bulgaria
-
 Cambodia
-
 Cameroon
-
 Canada
-
 Chile
Chile
-
 China
China
-
 Colombia
-
 Congo
Congo
-
 Costa Rica
-
 Cote d'Ivoire
-
 Croatia
-
 Cuba
Cuba
-
 Cyprus
-
 Czechia
-
 DR Congo
-
 Denmark
-
 Dominican Republic
-
 Ecuador
-
 Egypt
Egypt
-
 El Salvador
-
 Estonia
-
 Eswatini
-
 Ethiopia
-
 Finland
-
 France
-
 Georgia
-
 Germany
-
 Ghana
Ghana
-
 Greece
-
 Haiti
Haiti
-
 Hong Kong
-
 Hungary
-
 India
India
-
 Indonesia
-
 Iran, Islamic republic
-
 Iraq
Iraq
-
 Ireland
-
 Israel
-
 Italy
Italy
-
 Jamaica
-
 Japan
Japan
-
 Jordan
-
 Kazakhstan
-
 Kenya
Kenya
-
 Korea
Korea
-
 Kuwait
-
 Kyrgyzstan
-
 Laos
Laos
-
 Latvia
-
 Lebanon
-
 Lesotho
-
 Libya
Libya
-
 Lithuania
-
 Luxembourg
-
 Madagascar
-
 Malaysia
-
 Malta
Malta
-
 Mauritius
-
 Mexico
-
 Moldova
-
 Mongolia
-
 Montenegro
-
 Morocco
-
 Mozambique
-
 Myanmar
-
 Namibia
-
 Nepal
Nepal
-
 Netherlands
-
 New Zealand
-
 Nigeria
-
 North Macedonia
-
 Norway
-
 Oman
Oman
-
 Pakistan
-
 Palestine
-
 Panama
-
 Papua New Guinea
-
 Paraguay
-
 Peru
Peru
-
 Philippines
-
 Poland
-
 Portugal
-
 Puerto Rico
-
 Qatar
Qatar
-
 Reunion
-
 Romania
-
 Rwanda
-
 Saudi Arabia
-
 Serbia
-
 Singapore
-
 Slovakia
-
 Slovenia
-
 Somalia
-
 South Africa
-
 Spain
Spain
-
 Sri Lanka
-
 Sweden
-
 Switzerland
-
 Syria
Syria
-
 Taiwan
-
 Tajikistan
-
 Tanzania
-
 Thailand
-
 Trinidad and Tobago
-
 Tunisia
-
 Turkey
-
 UAE
UAE
-
 Uganda
-
 Ukraine
-
 United Kingdom
-
United States
-
 Uruguay
-
 Uzbekistan
-
 Venezuela
-
 Vietnam
-
 Yemen
Yemen
-
 Zambia
-
 Zimbabwe
- Forex
- Crypto












