

Floki trades near $0.0000233 support amid oversold conditions limiting further selling

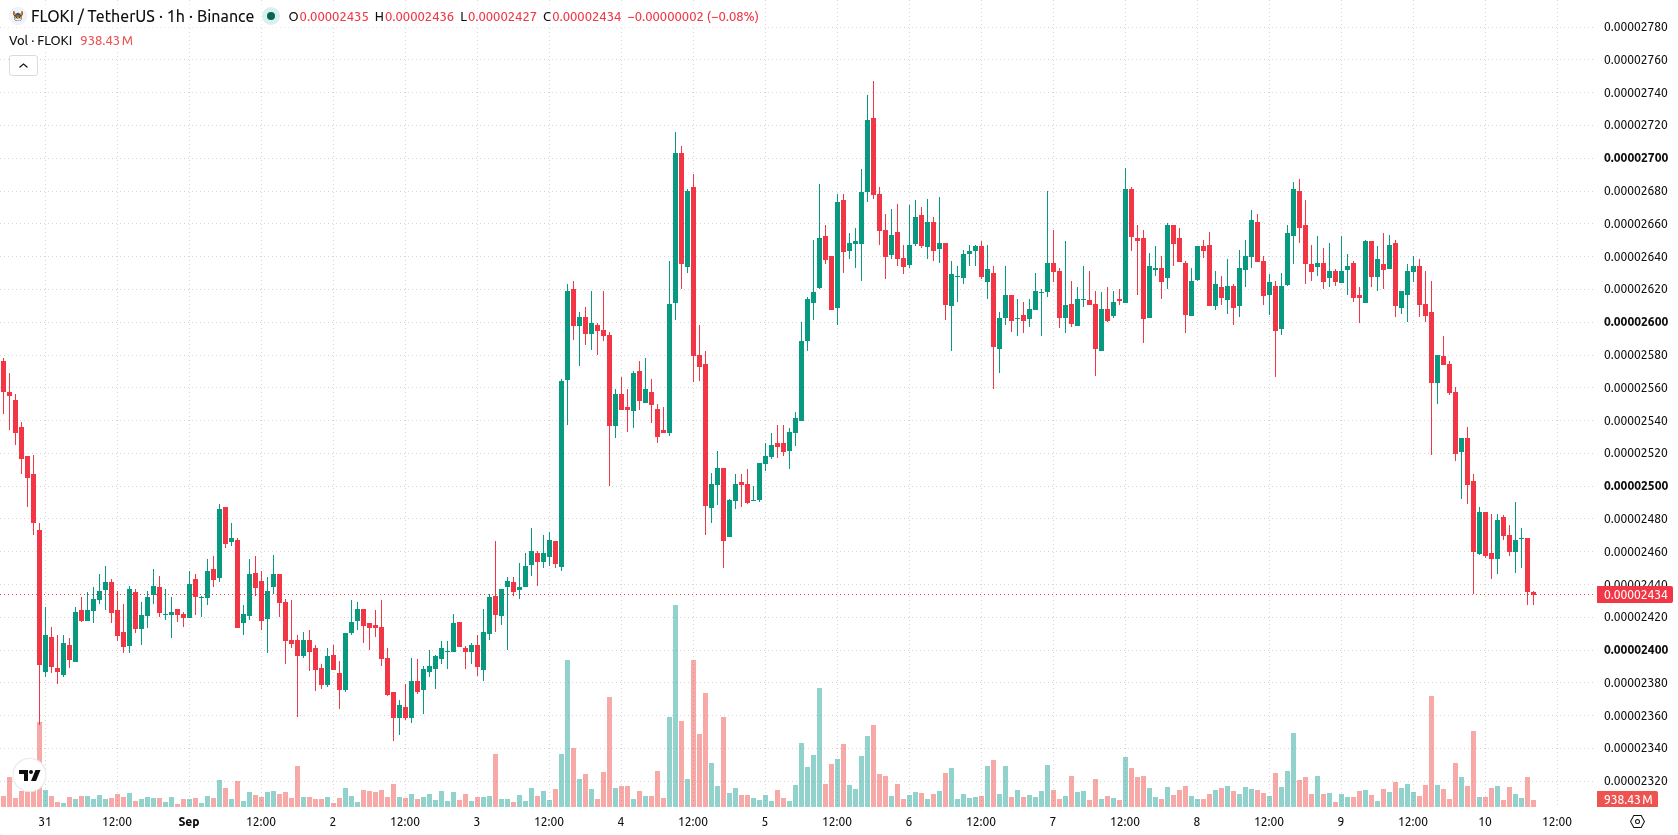
Floki (FLOKI) is trading at $0.000024, registering a daily decline of 8.06%. The asset is currently positioned below its key moving averages, indicating continued short-term pressure.
 0.0000229
0.00002515
Highlights
- FLOKI/USD is under persistent bearish pressure, trading below key moving averages across all time horizons.
- Momentum indicators show a strong sell bias, with conditions moderately oversold and sellers controlling intraday moves.
- FLOKI/USD is expected to trade between $0.0000233 and $0.00002529 over the next 2 to 3 days, with a high probability of further downside.
Persistent seller momentum as technical indicators confirm weakness
FLOKI/USD trades below the MA-20 ($0.00002517) and MA-50 ($0.00002586) on the hourly chart, with price continuing under the MA-200 ($0.00002669) over the long term. The Ichimoku Kijun level at $0.00002544 acts as immediate resistance. Hourly momentum indicators show both MACD and ADX signaling sell, RSI at 32.48 pointing towards moderately oversold territory and a sell bias, and CCI also signaling sell. Stoch RSI is neutral, while Bull/Bear Power indicates sellers remain in control of intraday momentum, and Awesome Oscillator is neutral. No significant divergence is present among oscillators; both momentum and price action confirm ongoing downside pressure.
Bearish trend likely as narrow range limits rebound potential
Over the next 2–3 trading days, FLOKI/USD is expected to fluctuate within the $0.0000233 to $0.00002529 range. The likelihood of an upward move remains very low, while the probability of downside continuation is high; an unexpected rally appears much less likely. The baseline scenario sees price remaining sideways within this current corridor. A breakout above resistance at $0.00002544 could open a bullish scenario, whereas a push below support at $0.0000233 would reinforce the prevailing bearish trend.
Earlier, analysts noted that Floki was exhibiting strong bullish momentum supported by favorable technical alignment. However, more recent price action and indicator readings signal a significant shift towards bearish pressure, making the $0.0000233 support level a critical threshold to monitor for potential downside continuation.










-
 Afghanistan
-
 Albania
-
 Algeria
-
 Angola
-
 Argentina
-
 Armenia
-
 Australia
-
 Austria
-
 Azerbaijan
-
 Bahamas
-
 Bahrain
-
 Bangladesh
-
 Belarus
-
 Belgium
-
 Bolivia
-
 Botswana
-
 Brazil
-
 Brunei
-
 Bulgaria
-
 Cambodia
-
 Cameroon
-
 Canada
-
 Chile
-
 China
-
 Colombia
-
 Congo
-
 Costa Rica
-
 Cote d'Ivoire
-
 Croatia
-
 Cuba
-
 Cyprus
-
 Czechia
-
 DR Congo
-
 Denmark
-
 Dominican Republic
-
 Ecuador
-
 Egypt
-
 El Salvador
-
 Estonia
-
 Eswatini
-
 Ethiopia
-
 Finland
-
 France
-
 Georgia
-
 Germany
-
 Ghana
-
 Greece
-
 Haiti
-
 Hong Kong
-
 Hungary
-
 India
-
 Indonesia
-
 Iran, Islamic republic
-
 Iraq
-
 Ireland
-
 Israel
-
 Italy
-
 Jamaica
-
 Japan
-
 Jordan
-
 Kazakhstan
-
 Kenya
-
 Korea
-
 Kuwait
-
 Kyrgyzstan
-
 Laos
-
 Latvia
-
 Lebanon
-
 Lesotho
-
 Libya
-
 Lithuania
-
 Luxembourg
-
 Madagascar
-
 Malaysia
-
 Malta
-
 Mauritius
-
 Mexico
-
 Moldova
-
 Mongolia
-
 Montenegro
-
 Morocco
-
 Mozambique
-
 Myanmar
-
 Namibia
-
 Nepal
-
 Netherlands
-
 New Zealand
-
 Nigeria
-
 North Macedonia
-
 Norway
-
 Oman
-
 Pakistan
-
 Palestine
-
 Panama
-
 Papua New Guinea
-
 Paraguay
-
 Peru
-
 Philippines
-
 Poland
-
 Portugal
-
 Puerto Rico
-
 Qatar
-
 Reunion
-
 Romania
-
 Rwanda
-
 Saudi Arabia
-
 Serbia
-
 Singapore
-
 Slovakia
-
 Slovenia
-
 Somalia
-
 South Africa
-
 Spain
-
 Sri Lanka
-
 Sweden
-
 Switzerland
-
 Syria
-
 Taiwan
-
 Tajikistan
-
 Tanzania
-
 Thailand
-
 Trinidad and Tobago
-
 Tunisia
-
 Turkey
-
 UAE
-
 Uganda
-
 Ukraine
-
 United Kingdom
-
United States
-
 Uruguay
-
 Uzbekistan
-
 Venezuela
-
 Vietnam
-
 Yemen
-
 Zambia
-
 Zimbabwe
- Forex
- Crypto












