

The Graph buyers push higher but momentum looks stretched: weekly analysis

The Graph (GRT) hovered near $0.021 after buyers drove a strong rally of more than 10% this week, reflecting accelerating interest but increasingly stretched momentum. With price action stalling just below recent highs and technical signals flashing caution, the setup is showing both strength and risk heading into the new week.
 0.02713
0.02922000
0.02713
0.02922000
Highlights
- The Graph advanced 10.81% over the past 7 days, breaking above short-term moving averages but holding below longer-term resistance.
- Momentum and trend indicators are firmly bullish, with volatility at 23.58% and buyers dominating near the top of the weekly trading range.
- Trading is expected between $0.01852869 and $0.024768 over the coming week, with $0.02091 as near-term resistance and $0.018565 as key support.
Bullish momentum holds as technical signals approach overbought territory
On the daily chart, the structure reflects a sustained move higher with a firm trend, supported by the MACD and ADX both signalling buy as volatility climbs to 23.58%. RSI, currently at 66.34 and approaching overbought territory, underscores short-term strength but signals caution as price nears resistance. The nearest support is set at $0.018565, anchored by the Ichimoku Kijun, while resistance stands at $0.02091, marking the recent weekly high. Price sitting at the top of its weekly range, alongside trend and momentum readings, favors bullish continuation in the immediate term.
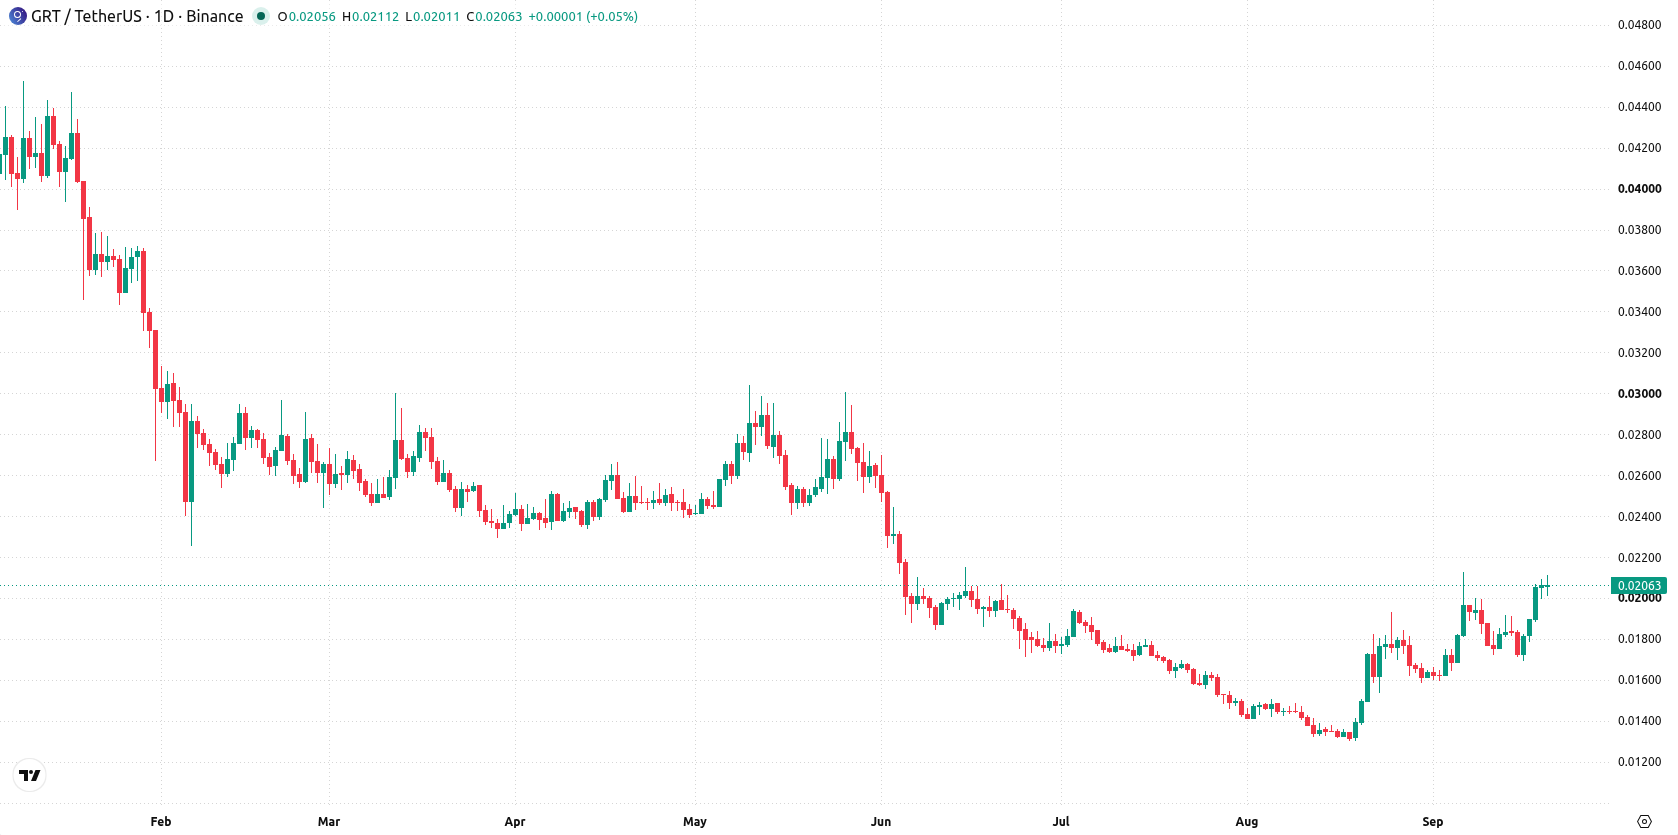
Upside bias prevails unless support fails in the coming week
Over the coming week, The Graph is expected to trade between $0.01852869 and $0.024768, with a very high probability of an increase and a very low probability of a decrease. The base case projects a move within this range while consolidating above the $0.018565 support. A bullish scenario sees an extension above $0.02091, targeting further gains towards the upper band of the forecast range. Any move below $0.018565 would suggest exhaustion and a potential retracement towards the lower bound.
Earlier, analysts noted that The Graph was exhibiting short-term bullish momentum, while caution was warranted due to persistent long-term resistance. The current technical environment reinforces this view, with elevated volatility and climbing momentum indicators suggesting the prevailing scenario is continued range-bound trading above $0.018565, but with sensitivity to potential shifts if price fails to hold support.











-
 Afghanistan
-
 Albania
-
 Algeria
-
 Angola
-
 Argentina
-
 Armenia
-
 Australia
-
 Austria
-
 Azerbaijan
-
 Bahamas
-
 Bahrain
-
 Bangladesh
-
 Belarus
-
 Belgium
-
 Bolivia
-
 Botswana
-
 Brazil
-
 Brunei
-
 Bulgaria
-
 Cambodia
-
 Cameroon
-
 Canada
-
 Chile
Chile
-
 China
China
-
 Colombia
-
 Congo
Congo
-
 Costa Rica
-
 Cote d'Ivoire
-
 Croatia
-
 Cuba
Cuba
-
 Cyprus
-
 Czechia
-
 DR Congo
-
 Denmark
-
 Dominican Republic
-
 Ecuador
-
 Egypt
Egypt
-
 El Salvador
-
 Estonia
-
 Eswatini
-
 Ethiopia
-
 Finland
-
 France
-
 Georgia
-
 Germany
-
 Ghana
Ghana
-
 Greece
-
 Haiti
Haiti
-
 Hong Kong
-
 Hungary
-
 India
India
-
 Indonesia
-
 Iran, Islamic republic
-
 Iraq
Iraq
-
 Ireland
-
 Israel
-
 Italy
Italy
-
 Jamaica
-
 Japan
Japan
-
 Jordan
-
 Kazakhstan
-
 Kenya
Kenya
-
 Korea
Korea
-
 Kuwait
-
 Kyrgyzstan
-
 Laos
Laos
-
 Latvia
-
 Lebanon
-
 Lesotho
-
 Libya
Libya
-
 Lithuania
-
 Luxembourg
-
 Madagascar
-
 Malaysia
-
 Malta
Malta
-
 Mauritius
-
 Mexico
-
 Moldova
-
 Mongolia
-
 Montenegro
-
 Morocco
-
 Mozambique
-
 Myanmar
-
 Namibia
-
 Nepal
Nepal
-
 Netherlands
-
 New Zealand
-
 Nigeria
-
 North Macedonia
-
 Norway
-
 Oman
Oman
-
 Pakistan
-
 Palestine
-
 Panama
-
 Papua New Guinea
-
 Paraguay
-
 Peru
Peru
-
 Philippines
-
 Poland
-
 Portugal
-
 Puerto Rico
-
 Qatar
Qatar
-
 Reunion
-
 Romania
-
 Rwanda
-
 Saudi Arabia
-
 Serbia
-
 Singapore
-
 Slovakia
-
 Slovenia
-
 Somalia
-
 South Africa
-
 Spain
Spain
-
 Sri Lanka
-
 Sweden
-
 Switzerland
-
 Syria
Syria
-
 Taiwan
-
 Tajikistan
-
 Tanzania
-
 Thailand
-
 Trinidad and Tobago
-
 Tunisia
-
 Turkey
-
 UAE
UAE
-
 Uganda
-
 Ukraine
-
 United Kingdom
-
United States
-
 Uruguay
-
 Uzbekistan
-
 Venezuela
-
 Vietnam
-
 Yemen
Yemen
-
 Zambia
-
 Zimbabwe
- Forex
- Crypto












