


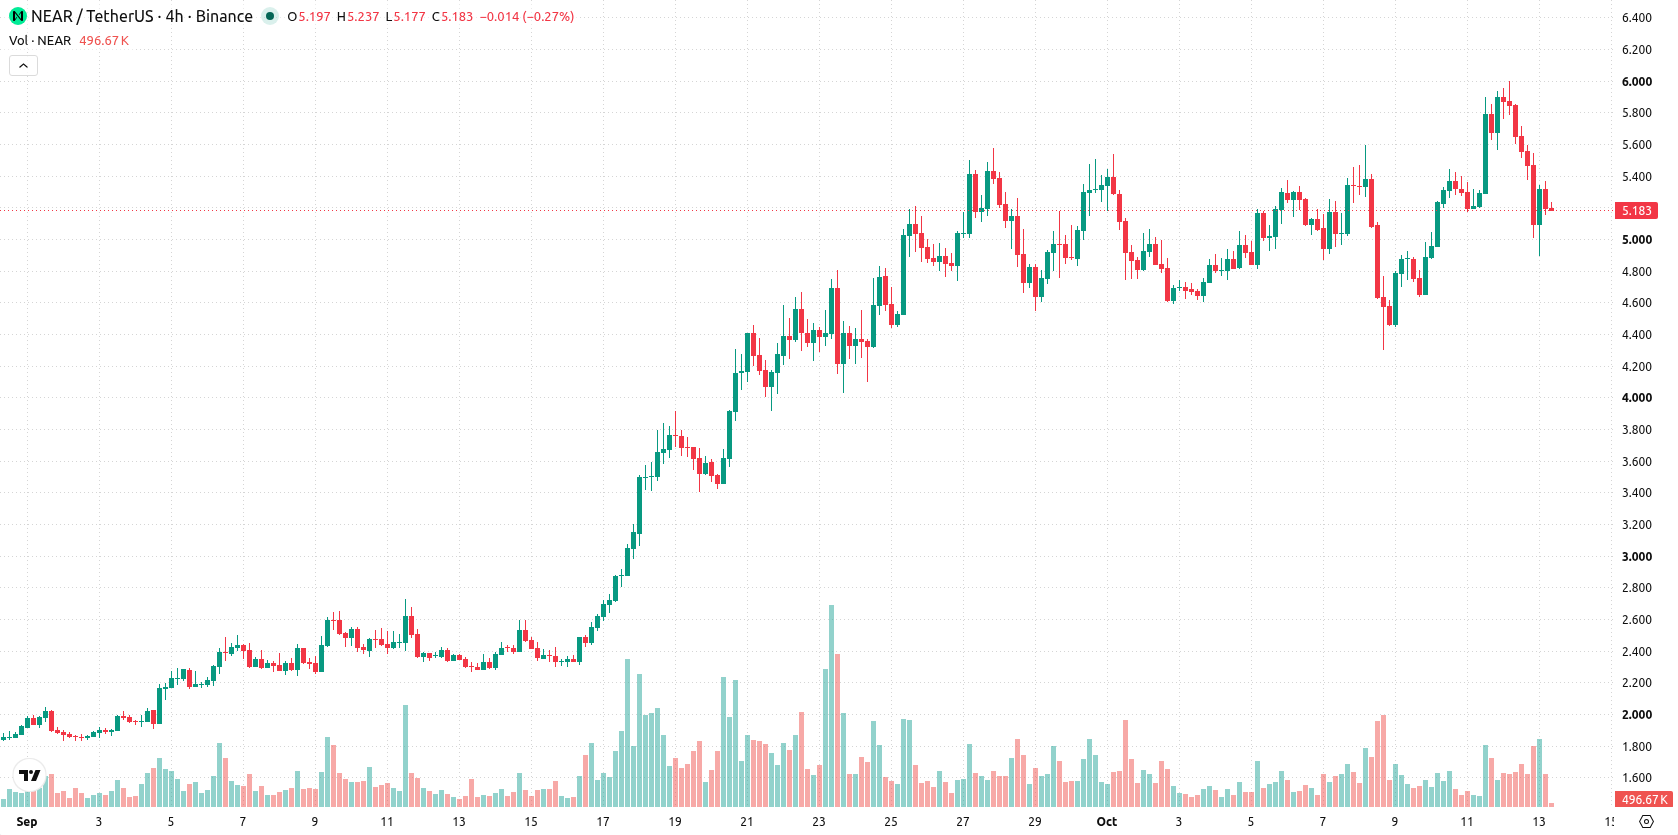
NEAR saw a sharp 10.12% drop, driven by a shift in short-term technical momentum as overbought signals and intraday selling pressure took precedence. The pullback contrasts with the overall bullish trend, as NEAR remains above key moving averages but faces immediate technical headwinds that limit further downside.
 5.368
6.0000
5.368
6.0000
Highlights
- NEAR is trading above its key moving averages, indicating sustained bullish momentum across all timeframes.
- Daily volatility is elevated at 9.78%, with the price at $5.195 and mixed indicator signals showing overbought conditions.
- Expected trading range for the next 5 days is $4.3455 to $6.0445, with a 57% probability of an upward move.
Mixed momentum as bullish trend meets overbought warnings
NEAR is maintaining its position above the 20-day, 50-day, and 200-day moving averages ($5.0134, $3.5051, and $2.1909), indicating persistent bullish momentum across timeframes. The immediate resistance is at $5.368, with support close at $5.0134, and the general trend remains positive. Momentum indicators, including the MACD and ADX, continue to signal a buy. The RSI is near neutral yet favors buyers, while the Stochastic RSI points to short-term selling pressure. Both the Commodity Channel Index and Bull/Bear Power highlight overbought conditions, and intraday activity is dominated by buyers. Daily price action is choppy within the current range, with volatility elevated at 9.78%. Overall, technical signals remain mixed as momentum stays positive, but oscillator warnings suggest caution.
Earlier, analysts noted that NEAR’s fundamental strength and rising ecosystem activity had set a bullish tone, contingent on buyers maintaining control above critical support levels. The current technical picture adds a layer of caution, as overbought signals and volatility point to a broad trading range between $4.3455 and $6.0445 in the coming week, with short-term price direction hinging on reactions at these boundaries.











-
 Afghanistan
-
 Albania
-
 Algeria
-
 Angola
-
 Argentina
-
 Armenia
-
 Australia
-
 Austria
-
 Azerbaijan
-
 Bahamas
-
 Bahrain
-
 Bangladesh
-
 Belarus
-
 Belgium
-
 Bolivia
-
 Botswana
-
 Brazil
-
 Brunei
-
 Bulgaria
-
 Cambodia
-
 Cameroon
-
 Canada
-
 Chile
Chile
-
 China
China
-
 Colombia
-
 Congo
Congo
-
 Costa Rica
-
 Cote d'Ivoire
-
 Croatia
-
 Cuba
Cuba
-
 Cyprus
-
 Czechia
-
 DR Congo
-
 Denmark
-
 Dominican Republic
-
 Ecuador
-
 Egypt
Egypt
-
 El Salvador
-
 Estonia
-
 Eswatini
-
 Ethiopia
-
 Finland
-
 France
-
 Georgia
-
 Germany
-
 Ghana
Ghana
-
 Greece
-
 Haiti
Haiti
-
 Hong Kong
-
 Hungary
-
 India
India
-
 Indonesia
-
 Iran, Islamic republic
-
 Iraq
Iraq
-
 Ireland
-
 Israel
-
 Italy
Italy
-
 Jamaica
-
 Japan
Japan
-
 Jordan
-
 Kazakhstan
-
 Kenya
Kenya
-
 Korea
Korea
-
 Kuwait
-
 Kyrgyzstan
-
 Laos
Laos
-
 Latvia
-
 Lebanon
-
 Lesotho
-
 Libya
Libya
-
 Lithuania
-
 Luxembourg
-
 Madagascar
-
 Malaysia
-
 Malta
Malta
-
 Mauritius
-
 Mexico
-
 Moldova
-
 Mongolia
-
 Montenegro
-
 Morocco
-
 Mozambique
-
 Myanmar
-
 Namibia
-
 Nepal
Nepal
-
 Netherlands
-
 New Zealand
-
 Nigeria
-
 North Macedonia
-
 Norway
-
 Oman
Oman
-
 Pakistan
-
 Palestine
-
 Panama
-
 Papua New Guinea
-
 Paraguay
-
 Peru
Peru
-
 Philippines
-
 Poland
-
 Portugal
-
 Puerto Rico
-
 Qatar
Qatar
-
 Reunion
-
 Romania
-
 Rwanda
-
 Saudi Arabia
-
 Serbia
-
 Singapore
-
 Slovakia
-
 Slovenia
-
 Somalia
-
 South Africa
-
 Spain
Spain
-
 Sri Lanka
-
 Sweden
-
 Switzerland
-
 Syria
Syria
-
 Taiwan
-
 Tajikistan
-
 Tanzania
-
 Thailand
-
 Trinidad and Tobago
-
 Tunisia
-
 Turkey
-
 UAE
UAE
-
 Uganda
-
 Ukraine
-
 United Kingdom
-
United States
-
 Uruguay
-
 Uzbekistan
-
 Venezuela
-
 Vietnam
-
 Yemen
Yemen
-
 Zambia
-
 Zimbabwe
- Forex
- Crypto












