

Tezos falls nearly 12% as technical selling pressure dominates session

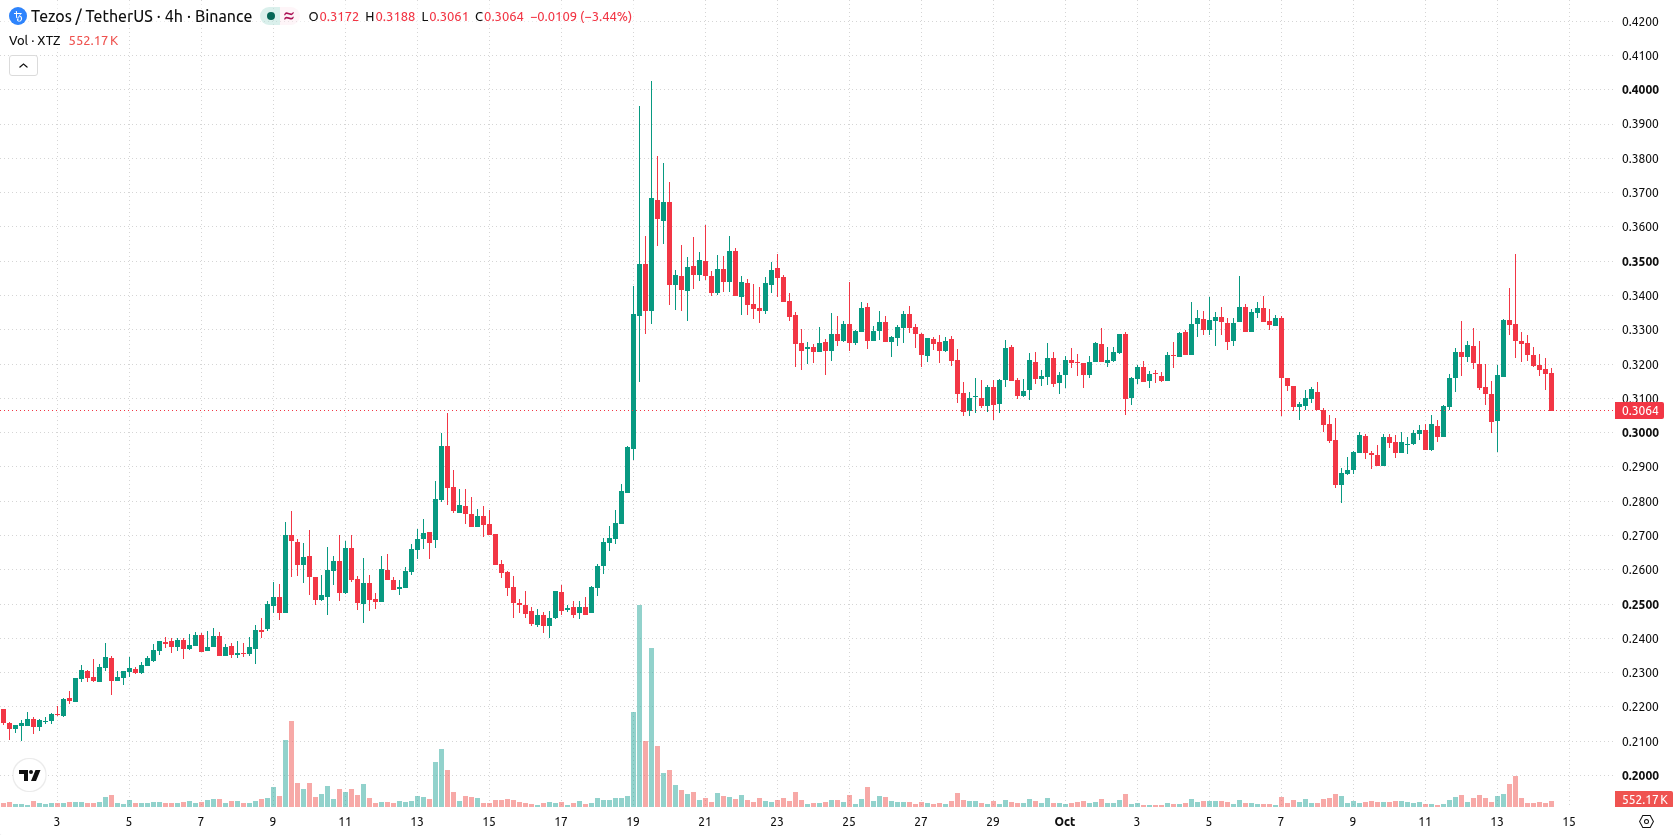
Tezos (XTZ) fell 11.65% today as technical selling pressure dominated the session. The move is supported by XTZ breaking below its 20-day moving average, even as medium- and long-term signals retain a bullish tilt.
 0.3247
0.35210000
0.3247
0.35210000
Highlights
- XTZ/USD is trading below its 20-day moving average but above the 50-day and 200-day averages, indicating short-term weakness and a medium-term bullish trend.
- Momentum indicators show strong upward signals and accumulation bias with buyers dominating intraday activity despite a sharp 11.65% drop and elevated volatility.
- The expected five-day range is $0.27005 to $0.34275 with an over 80% probability of an upward move and prevailing buy signals.
Medium-term bullish orientation holds despite failed short-term support
XTZ/USD is trading below its 20-day moving average at $0.318715 but remains above the 50-day ($0.283024) and 200-day ($0.282812) moving averages, highlighting short-term pressure but intact medium- and long-term bullish structure. The Ichimoku Kijun now acts as resistance at $0.32729999, with a near-term floor at $0.283024 and ceiling at $0.318715. Momentum signals are robust: both MACD and ADX indicate strong upward momentum, while the RSI at 55.98 and Stochastic RSI at 63.86 show an accumulation bias without overbought conditions. The Commodity Channel Index (CCI) is neutral at 43.60. Bull/Bear Power (BBP) remains above zero, and the Awesome Oscillator (AO) forecast supports ongoing buyer dominance. Price action is weak intraday with heightened volatility and the session sitting near lows.
Earlier, analysts noted that Tezos was exhibiting persistent bearish momentum and trading under pressure from sellers. The current technical landscape, however, introduces renewed upside risk, with traders advised to monitor $0.318715 as a potential breakout level that could shift momentum further in favor of buyers.











-
 Afghanistan
-
 Albania
-
 Algeria
-
 Angola
-
 Argentina
-
 Armenia
-
 Australia
-
 Austria
-
 Azerbaijan
-
 Bahamas
-
 Bahrain
-
 Bangladesh
-
 Belarus
-
 Belgium
-
 Bolivia
-
 Botswana
-
 Brazil
-
 Brunei
-
 Bulgaria
-
 Cambodia
-
 Cameroon
-
 Canada
-
 Chile
Chile
-
 China
China
-
 Colombia
-
 Congo
Congo
-
 Costa Rica
-
 Cote d'Ivoire
-
 Croatia
-
 Cuba
Cuba
-
 Cyprus
-
 Czechia
-
 DR Congo
-
 Denmark
-
 Dominican Republic
-
 Ecuador
-
 Egypt
Egypt
-
 El Salvador
-
 Estonia
-
 Eswatini
-
 Ethiopia
-
 Finland
-
 France
-
 Georgia
-
 Germany
-
 Ghana
Ghana
-
 Greece
-
 Haiti
Haiti
-
 Hong Kong
-
 Hungary
-
 India
India
-
 Indonesia
-
 Iran, Islamic republic
-
 Iraq
Iraq
-
 Ireland
-
 Israel
-
 Italy
Italy
-
 Jamaica
-
 Japan
Japan
-
 Jordan
-
 Kazakhstan
-
 Kenya
Kenya
-
 Korea
Korea
-
 Kuwait
-
 Kyrgyzstan
-
 Laos
Laos
-
 Latvia
-
 Lebanon
-
 Lesotho
-
 Libya
Libya
-
 Lithuania
-
 Luxembourg
-
 Madagascar
-
 Malaysia
-
 Malta
Malta
-
 Mauritius
-
 Mexico
-
 Moldova
-
 Mongolia
-
 Montenegro
-
 Morocco
-
 Mozambique
-
 Myanmar
-
 Namibia
-
 Nepal
Nepal
-
 Netherlands
-
 New Zealand
-
 Nigeria
-
 North Macedonia
-
 Norway
-
 Oman
Oman
-
 Pakistan
-
 Palestine
-
 Panama
-
 Papua New Guinea
-
 Paraguay
-
 Peru
Peru
-
 Philippines
-
 Poland
-
 Portugal
-
 Puerto Rico
-
 Qatar
Qatar
-
 Reunion
-
 Romania
-
 Rwanda
-
 Saudi Arabia
-
 Serbia
-
 Singapore
-
 Slovakia
-
 Slovenia
-
 Somalia
-
 South Africa
-
 Spain
Spain
-
 Sri Lanka
-
 Sweden
-
 Switzerland
-
 Syria
Syria
-
 Taiwan
-
 Tajikistan
-
 Tanzania
-
 Thailand
-
 Trinidad and Tobago
-
 Tunisia
-
 Turkey
-
 UAE
UAE
-
 Uganda
-
 Ukraine
-
 United Kingdom
-
United States
-
 Uruguay
-
 Uzbekistan
-
 Venezuela
-
 Vietnam
-
 Yemen
Yemen
-
 Zambia
-
 Zimbabwe
- Forex
- Crypto












