

VeChain weekly forecast: Downtrend persists as key support at $0.005578 comes into focus

VeChain (VET) is trading near $0.0059 after sliding around 18% over the past week, with heavy selling and oversold conditions setting the tone for the days ahead. The setup reflects deep institutional fatigue, but technical signals will determine whether a rebound can take hold or downside persists in the coming week.
 0.005855
0.00659600
Highlights
- VeChain trades at $0.005875, down 17.72% over the past 7 days, maintaining a firmly bearish structure below major moving averages.
- Oversold readings on daily RSI, CCI, and Stochastic RSI suggest selling pressure may be nearing exhaustion, allowing potential for a short-term rebound.
- Expected range is $0.00514688 to $0.00660311 this week, with a 21% chance of increase and 79% likelihood of further decline.
Strategic partnerships bolster outlook as long-term blockchain use draws attention
LiteFinance published a detailed review of VeChain's price history, its strategic partnerships with BMW, PwC, and Walmart China, and highlighted the importance of the VeChainThor blockchain for long-term growth, offering historical perspective for institutional observers.
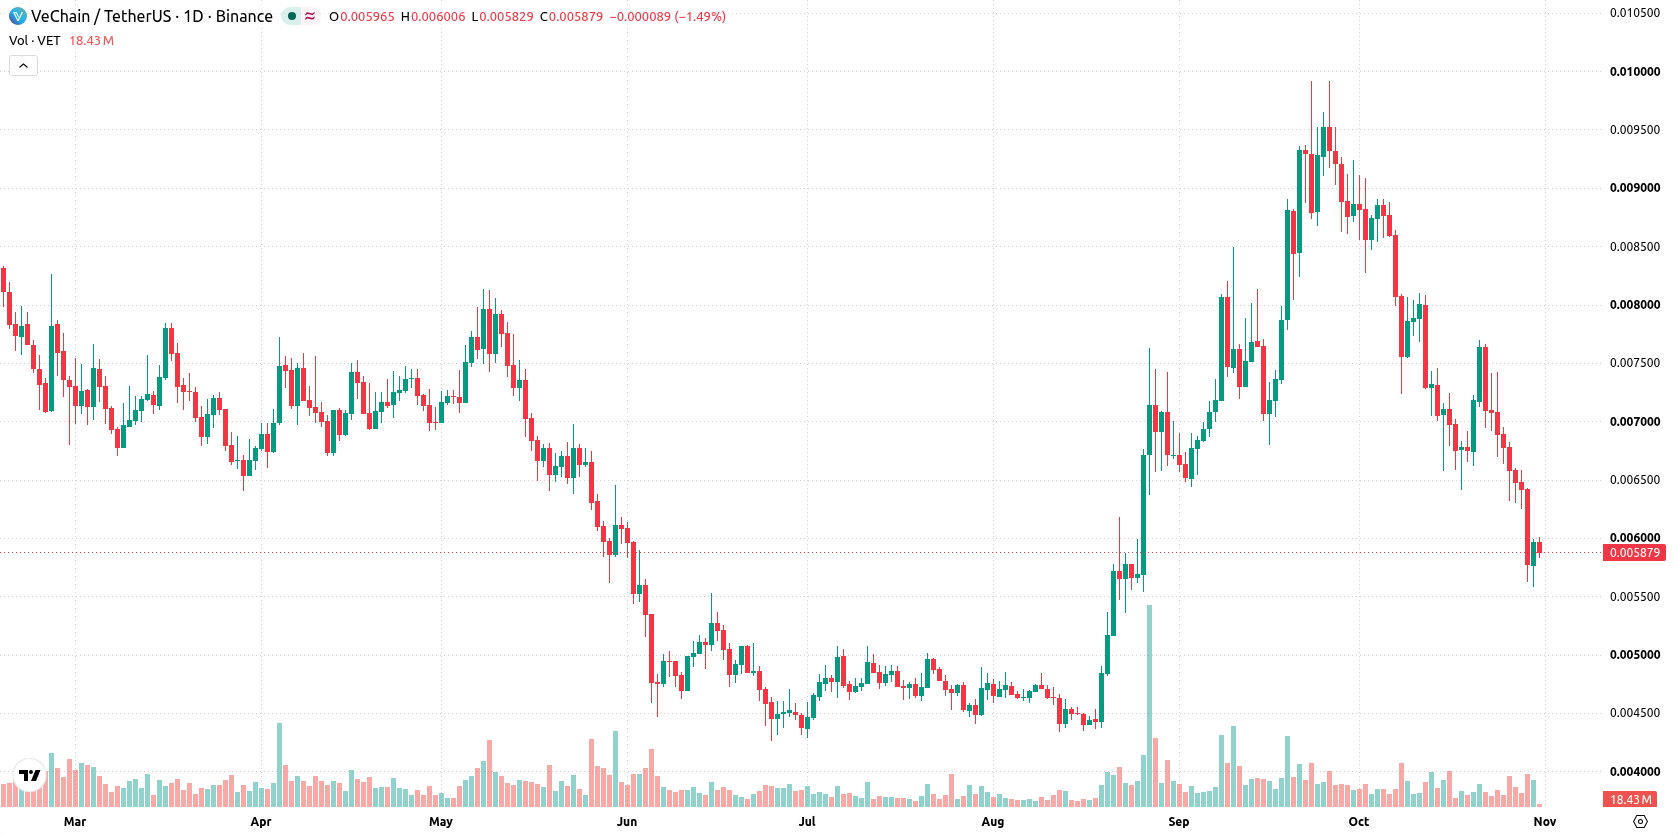
Bearish momentum persists over the week as oversold signals hint at reversal risk
On the daily chart, the trend is firmly to the downside, characterized as a sustained move lower with a firm trend. Daily RSI, CCI, and Stochastic RSI are all in their respective oversold zones, which signals possible selling exhaustion and the potential for an upside rebound in the near term. Meanwhile, MACD and ADX both align with the prevailing downtrend, underscoring continued bearish momentum. With volatility readings at 24.67%, conditions remain unsettled. Nearest support is at $0.005578, while resistance comes in at $0.00627443, with the Ichimoku Kijun at $0.007242 acting as an additional resistance barrier.
Downside favored next week unless key resistance triggers bullish breakout
In the week ahead, VeChain is expected to trade between $0.00514688 and $0.00660311. There is a 21% probability of an increase and a 79% likelihood of a decrease. The base case favors continued pressure within the defined range. A move above $0.00627443 would open a bullish scenario, targeting resistance levels, while a drop below $0.005578 would confirm renewed downside momentum.
Earlier, analysts noted that VeChain was exhibiting persistent bearish momentum amid sustained selling pressure and technical weakness. The current analysis underscores this downside bias with volatility persisting, highlighting $0.005578 as the critical support level for traders to monitor in the days ahead.










-
 Afghanistan
-
 Albania
-
 Algeria
-
 Angola
-
 Argentina
-
 Armenia
-
 Australia
-
 Austria
-
 Azerbaijan
-
 Bahamas
-
 Bahrain
-
 Bangladesh
-
 Belarus
-
 Belgium
-
 Bolivia
-
 Botswana
-
 Brazil
-
 Brunei
-
 Bulgaria
-
 Cambodia
-
 Cameroon
-
 Canada
-
 Chile
-
 China
-
 Colombia
-
 Congo
-
 Costa Rica
-
 Cote d'Ivoire
-
 Croatia
-
 Cuba
-
 Cyprus
-
 Czechia
-
 DR Congo
-
 Denmark
-
 Dominican Republic
-
 Ecuador
-
 Egypt
-
 El Salvador
-
 Estonia
-
 Eswatini
-
 Ethiopia
-
 Finland
-
 France
-
 Georgia
-
 Germany
-
 Ghana
-
 Greece
-
 Haiti
-
 Hong Kong
-
 Hungary
-
 India
-
 Indonesia
-
 Iran, Islamic republic
-
 Iraq
-
 Ireland
-
 Israel
-
 Italy
-
 Jamaica
-
 Japan
-
 Jordan
-
 Kazakhstan
-
 Kenya
-
 Korea
-
 Kuwait
-
 Kyrgyzstan
-
 Laos
-
 Latvia
-
 Lebanon
-
 Lesotho
-
 Libya
-
 Lithuania
-
 Luxembourg
-
 Madagascar
-
 Malaysia
-
 Malta
-
 Mauritius
-
 Mexico
-
 Moldova
-
 Mongolia
-
 Montenegro
-
 Morocco
-
 Mozambique
-
 Myanmar
-
 Namibia
-
 Nepal
-
 Netherlands
-
 New Zealand
-
 Nigeria
-
 North Macedonia
-
 Norway
-
 Oman
-
 Pakistan
-
 Palestine
-
 Panama
-
 Papua New Guinea
-
 Paraguay
-
 Peru
-
 Philippines
-
 Poland
-
 Portugal
-
 Puerto Rico
-
 Qatar
-
 Reunion
-
 Romania
-
 Rwanda
-
 Saudi Arabia
-
 Serbia
-
 Singapore
-
 Slovakia
-
 Slovenia
-
 Somalia
-
 South Africa
-
 Spain
-
 Sri Lanka
-
 Sweden
-
 Switzerland
-
 Syria
-
 Taiwan
-
 Tajikistan
-
 Tanzania
-
 Thailand
-
 Trinidad and Tobago
-
 Tunisia
-
 Turkey
-
 UAE
-
 Uganda
-
 Ukraine
-
 United Kingdom
-
United States
-
 Uruguay
-
 Uzbekistan
-
 Venezuela
-
 Vietnam
-
 Yemen
-
 Zambia
-
 Zimbabwe
- Forex
- Crypto












