
WLFI holds narrow range as momentum fades and EMAs tighten

World Liberty Financial’s token is trading in a narrow band near $0.147 as short-term momentum fades and the market slips into a controlled drift lower. The latest charts show a structure attempting to hold support, even as repeated failures near key moving averages limit the recovery that began earlier in the month.
Highlights
- WLFI trades near $0.147 after stalled early-month recovery.
- Resistance builds at $0.151 as EMA cluster turns lower.
- RSI near 42 signals weakening momentum without capitulation.
The market’s tone reflects hesitation. The 4-hour chart shows multiple rejections around a compressed cluster of moving averages, all of which have started to lean downward. When price is pinned beneath a tight EMA stack, it often signals that directional conviction is fading. WLFI is not breaking down sharply, but the slow drift lower shows sellers retaining a slight edge.
Momentum cools as price stays below key EMAs
WLFI remains under all major EMAs. The 20-EMA at $0.151 and the 50-EMA at $0.152 sit directly overhead, while the 100-EMA at $0.1528 and the 200-EMA at $0.1507 have converged into a compact band. This compression usually precedes a decisive move. Trading below these levels indicates the broader bias still favors sellers, but the convergence also underscores that buyers are defending the same zone with consistency.
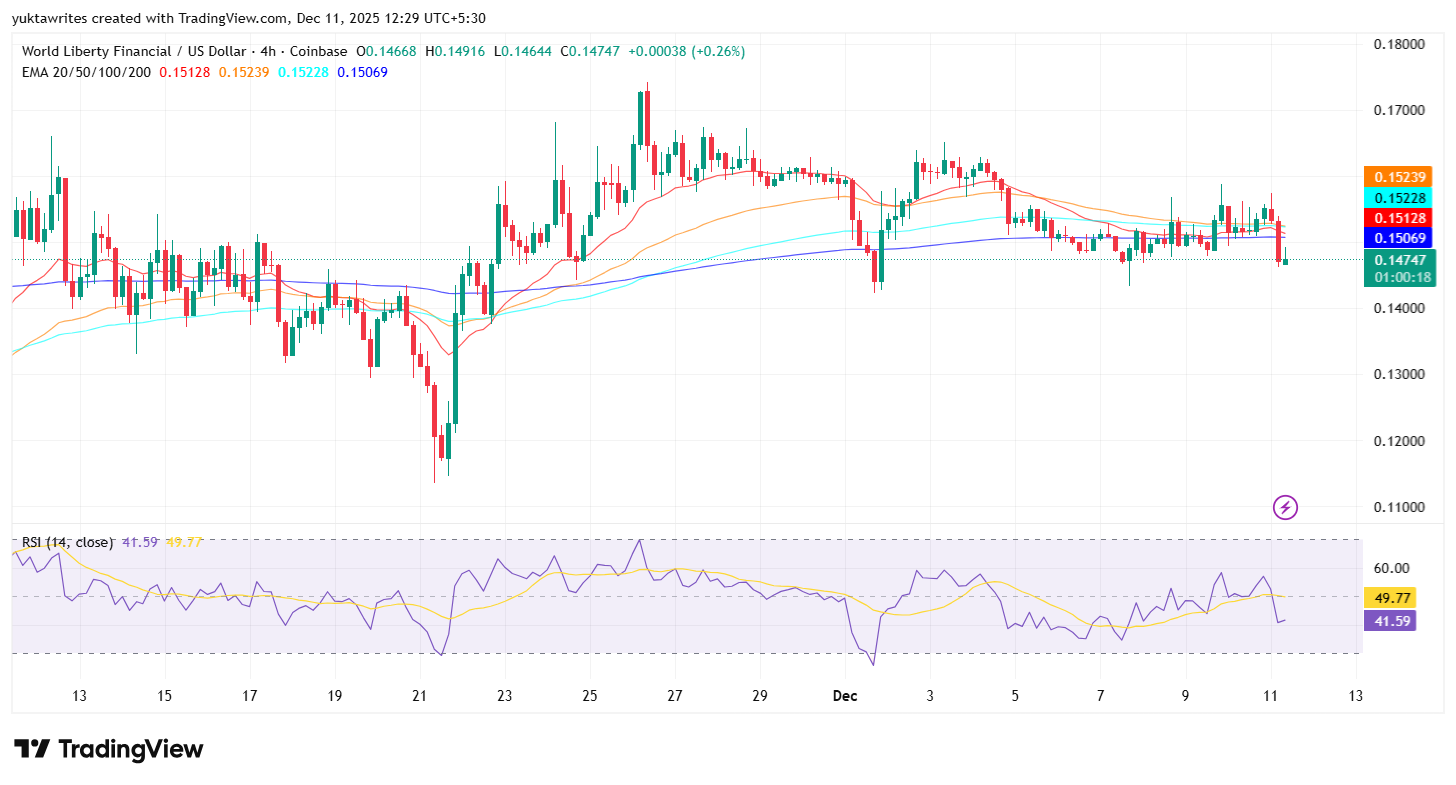
WLFI price dynamics (Source: TradingView)
RSI on the 4-hour timeframe near 42 aligns with a market drifting rather than collapsing. Bounces struggle to move through the mid-0.15 region, yet sellers have not forced a breakdown either. WLFI is signaling a stalemate, with bearish momentum present but not dominant enough to extend losses beyond support.
Short-term structure shows sellers fading rallies
Intraday charts reinforce the cautious tone. On the 30-minute timeframe, Supertrend flipped red at $0.151 and remained firmly above price. Parabolic SAR prints continue above candles, highlighting ongoing downtrend pressure. Attempts to push above 0.1505 have been consistently rejected, a sign that short-term traders are fading strength rather than positioning for upside continuation.
Despite these signals, buyers continue to defend the $0.147 region. Repeated wick tests show accumulation at this level, keeping WLFI from slipping into deeper weakness. A close below $0.147 would open a cleaner move toward $0.145, which remains the next notable demand zone. Reclaiming $0.151, however, shifts the tone significantly by flipping Supertrend green and pulling the token back toward $0.153 and $0.156, where earlier liquidity clusters sit.
WLFI’s current compression between resistance at $0.151 and support at $0.147 reflects a market waiting for a catalyst. With moving averages tightening and momentum indicators softening, whichever side breaks first will likely dictate the next wave of direction.
Outlook as WLFI tests its tightening range
WLFI trades inside a quiet but controlled bearish drift, with both buyers and sellers holding firm near their respective levels. A close above the EMA cluster would confirm the start of a recovery phase. A close below support would hand momentum to sellers and accelerate downside pressure. Until either event occurs, the market remains balanced, signaling consolidation rather than a defined trend.
Previously, we discussed how WLFI’s failed breakouts and weakening momentum kept price pinned under resistance bands despite steady support. The current structure reflects the same theme, with the token still searching for direction within a tightening technical range.


Latest Forecast News


-
 Afghanistan
-
 Albania
-
 Algeria
-
 Angola
-
 Argentina
-
 Armenia
-
 Australia
-
 Austria
-
 Azerbaijan
-
 Bahamas
-
 Bahrain
-
 Bangladesh
-
 Belarus
-
 Belgium
-
 Bolivia
-
 Botswana
-
 Brazil
-
 Brunei
-
 Bulgaria
-
 Cambodia
-
 Cameroon
-
 Canada
-
 Chile
Chile
-
 China
China
-
 Colombia
-
 Congo
Congo
-
 Costa Rica
-
 Cote d'Ivoire
-
 Croatia
-
 Cuba
Cuba
-
 Cyprus
-
 Czechia
-
 DR Congo
-
 Denmark
-
 Dominican Republic
-
 Ecuador
-
 Egypt
Egypt
-
 El Salvador
-
 Estonia
-
 Eswatini
-
 Ethiopia
-
 Finland
-
 France
-
 Georgia
-
 Germany
-
 Ghana
Ghana
-
 Greece
-
 Haiti
Haiti
-
 Hong Kong
-
 Hungary
-
 India
India
-
 Indonesia
-
 Iran, Islamic republic
-
 Iraq
Iraq
-
 Ireland
-
 Israel
-
 Italy
Italy
-
 Jamaica
-
 Japan
Japan
-
 Jordan
-
 Kazakhstan
-
 Kenya
Kenya
-
 Korea
Korea
-
 Kuwait
-
 Kyrgyzstan
-
 Laos
Laos
-
 Latvia
-
 Lebanon
-
 Lesotho
-
 Libya
Libya
-
 Lithuania
-
 Luxembourg
-
 Madagascar
-
 Malaysia
-
 Malta
Malta
-
 Mauritius
-
 Mexico
-
 Moldova
-
 Mongolia
-
 Montenegro
-
 Morocco
-
 Mozambique
-
 Myanmar
-
 Namibia
-
 Nepal
Nepal
-
 Netherlands
-
 New Zealand
-
 Nigeria
-
 North Macedonia
-
 Norway
-
 Oman
Oman
-
 Pakistan
-
 Palestine
-
 Panama
-
 Papua New Guinea
-
 Paraguay
-
 Peru
Peru
-
 Philippines
-
 Poland
-
 Portugal
-
 Puerto Rico
-
 Qatar
Qatar
-
 Reunion
-
 Romania
-
 Rwanda
-
 Saudi Arabia
-
 Serbia
-
 Singapore
-
 Slovakia
-
 Slovenia
-
 Somalia
-
 South Africa
-
 Spain
Spain
-
 Sri Lanka
-
 Sweden
-
 Switzerland
-
 Syria
Syria
-
 Taiwan
-
 Tajikistan
-
 Tanzania
-
 Thailand
-
 Trinidad and Tobago
-
 Tunisia
-
 Turkey
-
 UAE
UAE
-
 Uganda
-
 Ukraine
-
 United Kingdom
-
United States
-
 Uruguay
-
 Uzbekistan
-
 Venezuela
-
 Vietnam
-
 Yemen
Yemen
-
 Zambia
-
 Zimbabwe
- Forex
- Crypto
