
AstraZeneca stock: institutional inflows and strong technicals support sideways trend

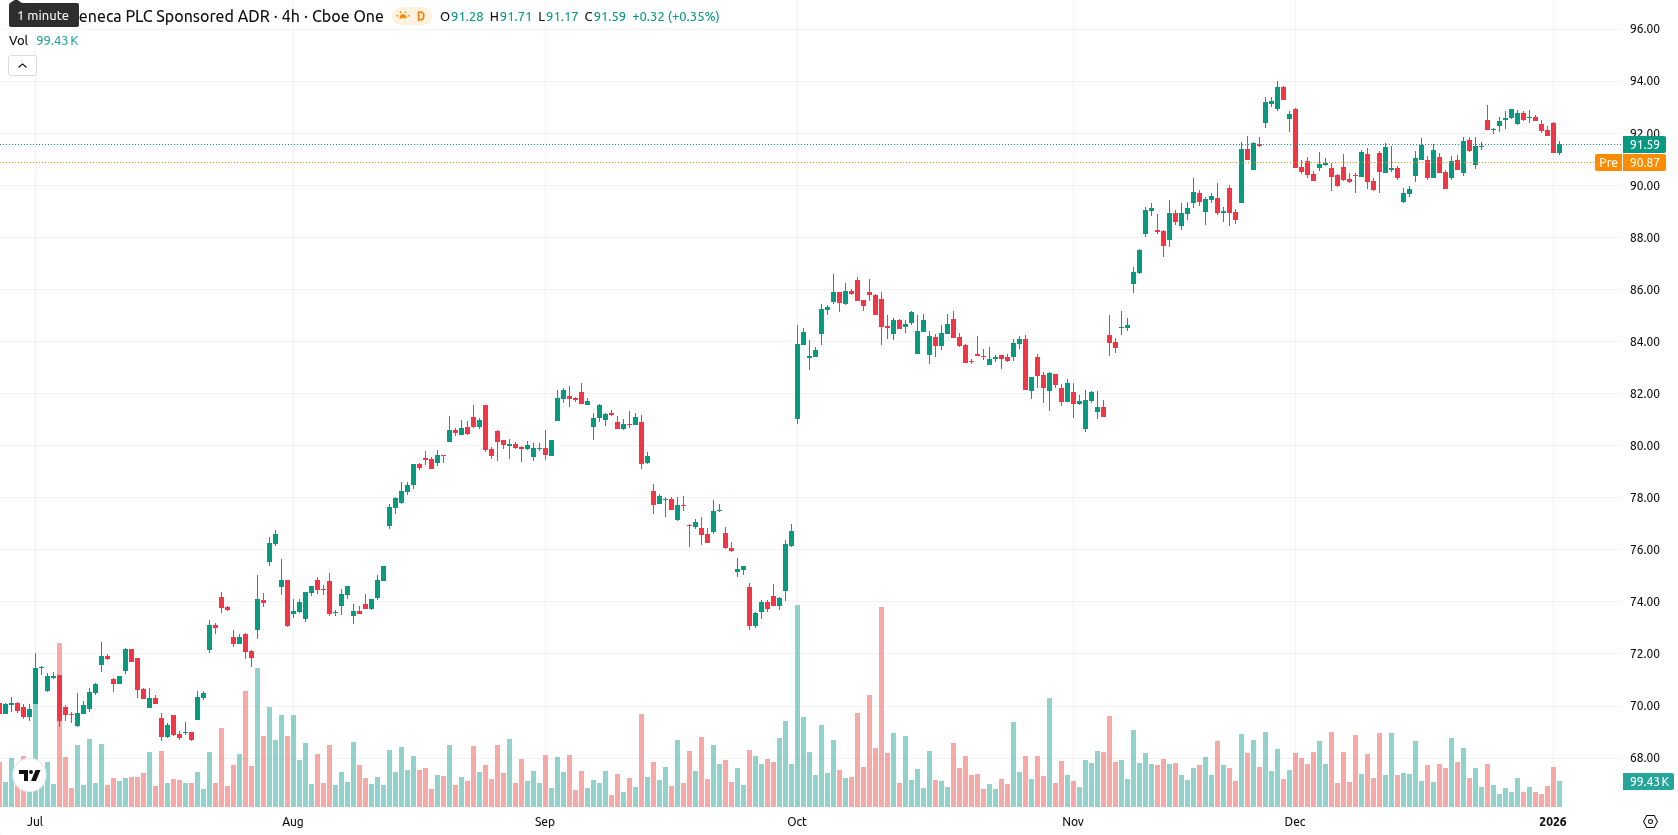
AstraZeneca PLC (AZN) is trading at GBX 13,568.00, down 24.00 points or 0.18% today. The asset is trading below the MA-20 (GBX 13,619.20) but remains above the MA-50 (GBX 13,374.40) and well above the MA-200 (GBX 11,639.19), signaling short-term pressure but a bullish medium- and long-term trend.
Highlights
- AstraZeneca appointed James Yuan, previously of Merck Sharp & Dohme, as executive legal director, signaling a significant executive leadership change.
- Institutional investors, including Boston Common Asset Management, increased their stakes in AstraZeneca, reflecting continued investor confidence in the company's stability.
- AstraZeneca remains recognized in the healthcare sector for its defensive profile and consistent dividend payments.
Leadership change and investor inflows strengthen defensive profile
AstraZeneca recently appointed James Yuan, formerly of Merck Sharp & Dohme, as its executive legal director, marking a notable change in executive leadership. Institutional investors such as Boston Common Asset Management have increased their stakes in the company, underlining sustained investor interest in AstraZeneca's stability within the healthcare sector. The company continues to be recognized for its defensive qualities and consistent dividend payments.
Technical boundaries steady as bullish momentum signals persist
Technically, the nearest support for AZN lies at the MA-50 (GBX 13,374.40), while resistance is identified at the MA-20 and the Ichimoku Kijun level (GBX 14,418.18). Momentum readings remain supportive: the daily MACD signals strong buy, the ADX is robust at 36.45, and while RSI (52.21) and CCI (45.52) are neutral-to-positive, the Stochastic RSI at 30.68 hints at an overbought-to-oversold transition. Bull/Bear Power (BBP) indicates prevailing buyer strength (245.11, overbought), whereas the Awesome Oscillator is neutral, highlighting some near-term momentum indecision.
High breakout potential as consolidation dominates short-term outlook
For the coming week, the typical volatility band is projected between GBX 13,282.00 and GBX 13,800.00, reflecting a ±2.5–3% range around the current level. The probability of further price gains is high (above 80%) given ongoing buy signals from the RSI, ADX, MACD, and weekly moving averages, while the likelihood of a short-term decline is low (below 20%). AZN is expected to consolidate sideways near current levels. If there is a breakout above the MA-20 and the Kijun, an advance toward the GBX 13,800.00–13,900.00 zone is possible; should support at the MA-50 give way, a move toward GBX 13,300.00–13,350.00 could follow.
Previously it was reported that AstraZeneca PLC remains in a firm uptrend, trading consistently above its key moving averages with institutional buying and strong momentum indicators such as MACD and ADX supporting continued bullish sentiment. However, with RSI and other oscillators flagging overbought conditions and dynamic resistance overhead, a period of sideways consolidation within a defined range is likely before any potential breakout.


Latest AstraZeneca News


-
 Afghanistan
-
 Albania
-
 Algeria
-
 Angola
-
 Argentina
-
 Armenia
-
 Australia
-
 Austria
-
 Azerbaijan
-
 Bahamas
-
 Bahrain
-
 Bangladesh
-
 Belarus
-
 Belgium
-
 Bolivia
-
 Botswana
-
 Brazil
-
 Brunei
-
 Bulgaria
-
 Cambodia
-
 Cameroon
-
 Canada
-
 Chile
Chile
-
 China
China
-
 Colombia
-
 Congo
Congo
-
 Costa Rica
-
 Cote d'Ivoire
-
 Croatia
-
 Cuba
Cuba
-
 Cyprus
-
 Czechia
-
 DR Congo
-
 Denmark
-
 Dominican Republic
-
 Ecuador
-
 Egypt
Egypt
-
 El Salvador
-
 Estonia
-
 Eswatini
-
 Ethiopia
-
 Finland
-
 France
-
 Georgia
-
 Germany
-
 Ghana
Ghana
-
 Greece
-
 Haiti
Haiti
-
 Hong Kong
-
 Hungary
-
 India
India
-
 Indonesia
-
 Iran, Islamic republic
-
 Iraq
Iraq
-
 Ireland
-
 Israel
-
 Italy
Italy
-
 Jamaica
-
 Japan
Japan
-
 Jordan
-
 Kazakhstan
-
 Kenya
Kenya
-
 Korea
Korea
-
 Kuwait
-
 Kyrgyzstan
-
 Laos
Laos
-
 Latvia
-
 Lebanon
-
 Lesotho
-
 Libya
Libya
-
 Lithuania
-
 Luxembourg
-
 Madagascar
-
 Malaysia
-
 Malta
Malta
-
 Mauritius
-
 Mexico
-
 Moldova
-
 Mongolia
-
 Montenegro
-
 Morocco
-
 Mozambique
-
 Myanmar
-
 Namibia
-
 Nepal
Nepal
-
 Netherlands
-
 New Zealand
-
 Nigeria
-
 North Macedonia
-
 Norway
-
 Oman
Oman
-
 Pakistan
-
 Palestine
-
 Panama
-
 Papua New Guinea
-
 Paraguay
-
 Peru
Peru
-
 Philippines
-
 Poland
-
 Portugal
-
 Puerto Rico
-
 Qatar
Qatar
-
 Reunion
-
 Romania
-
 Rwanda
-
 Saudi Arabia
-
 Serbia
-
 Singapore
-
 Slovakia
-
 Slovenia
-
 Somalia
-
 South Africa
-
 Spain
Spain
-
 Sri Lanka
-
 Sweden
-
 Switzerland
-
 Syria
Syria
-
 Taiwan
-
 Tajikistan
-
 Tanzania
-
 Thailand
-
 Trinidad and Tobago
-
 Tunisia
-
 Turkey
-
 UAE
UAE
-
 Uganda
-
 Ukraine
-
 United Kingdom
-
United States
-
 Uruguay
-
 Uzbekistan
-
 Venezuela
-
 Vietnam
-
 Yemen
Yemen
-
 Zambia
-
 Zimbabwe
- Forex
- Crypto
