
AstraZeneca stock: technical strength meets intraday selling for sideways action

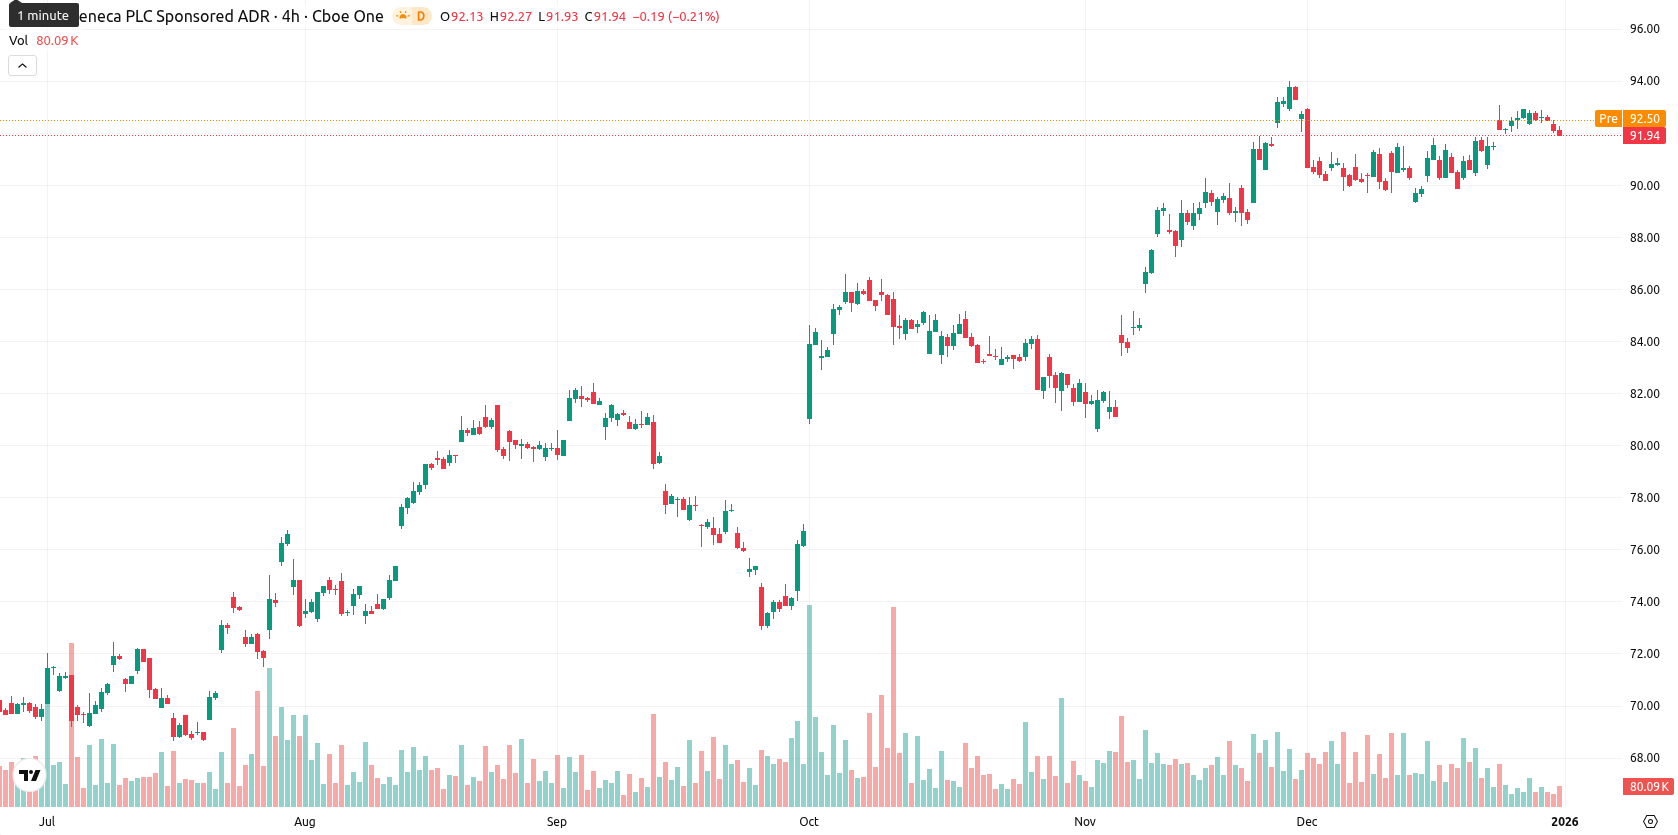
AstraZeneca PLC (AZN) is currently trading at GBX 13,752.00, holding well above its MA-20 (GBX 13,627.30), MA-50 (GBX 13,351.12), and MA-200 (GBX 11,629.92), confirming persistent bullish momentum across short, medium, and long-term timeframes. Despite a moderate daily drop of 0.28%, the asset remains comfortably above these key moving averages and sits mid-range for the day between GBX 13,722.00 and GBX 13,918.00, with moderate intraday volatility and no significant opening gap.
Highlights
- My Personal CFO LLC acquired 38,411 shares of AstraZeneca during Q3, with the transaction valued at approximately $2.95 million.
- Current disclosures show no major product launches, regulatory actions, or significant operational changes reported by AstraZeneca.
- AstraZeneca remains under review by multiple research reports, reflecting sustained institutional interest amid stable operational disclosures.
Institutional buying rises amid lack of material operational catalysts
Recent filings indicate that My Personal CFO LLC acquired 38,411 shares of AstraZeneca during the third quarter, a transaction valued at approximately $2.95 million. AstraZeneca continues to be the focus of multiple research reports, but no disclosure of major product launches, regulatory actions, or significant operational changes has been identified in current disclosures.
Momentum divergence emerges as overbought signals cap further upside
Momentum indicators on the daily chart remain constructive, with both MACD and ADX signaling ongoing buyer strength. RSI holds in bullish territory at 60.06, and CCI confirms this bias; however, Stoch RSI and Bull/Bear Power (BBP) point to overbought conditions, which raises the risk of a near-term pullback or consolidation. The nearest dynamic resistance appears near the MA-50 and round psychological levels above, with the Ichimoku Kijun at GBX 14,418.18 adding an additional overhead hurdle. Awesome Oscillator supports the trending momentum, but there is moderate divergence between strong underlying momentum and short-term overextension signals; intraday tone is mildly pressured after the open.
Sideways consolidation expected as upside probability outweighs risks
For the coming five trading days, AZN is expected to trade within a volatility band of GBX 13,400 to GBX 14,000, reflecting typical volatility relative to current levels. The probability of an upside move is very high (over 80%), while downside risk appears limited under present momentum conditions. The baseline outlook is sideways consolidation inside this range. An upward breakout could drive AZN to new highs above GBX 14,000, whereas a slide below GBX 13,400 would likely result in a short-term correction.
Last time, analysts noted that AstraZeneca PLC continues to exhibit bullish momentum, trading above its key moving averages with positive MACD and ADX signals, while institutional accumulation further validates the uptrend. However, certain momentum oscillators indicate overbought conditions, suggesting the potential for short-term consolidation within a well-defined price range before further directional moves.


Latest AstraZeneca News


-
 Afghanistan
-
 Albania
-
 Algeria
-
 Angola
-
 Argentina
-
 Armenia
-
 Australia
-
 Austria
-
 Azerbaijan
-
 Bahamas
-
 Bahrain
-
 Bangladesh
-
 Belarus
-
 Belgium
-
 Bolivia
-
 Botswana
-
 Brazil
-
 Brunei
-
 Bulgaria
-
 Cambodia
-
 Cameroon
-
 Canada
-
 Chile
Chile
-
 China
China
-
 Colombia
-
 Congo
Congo
-
 Costa Rica
-
 Cote d'Ivoire
-
 Croatia
-
 Cuba
Cuba
-
 Cyprus
-
 Czechia
-
 DR Congo
-
 Denmark
-
 Dominican Republic
-
 Ecuador
-
 Egypt
Egypt
-
 El Salvador
-
 Estonia
-
 Eswatini
-
 Ethiopia
-
 Finland
-
 France
-
 Georgia
-
 Germany
-
 Ghana
Ghana
-
 Greece
-
 Haiti
Haiti
-
 Hong Kong
-
 Hungary
-
 India
India
-
 Indonesia
-
 Iran, Islamic republic
-
 Iraq
Iraq
-
 Ireland
-
 Israel
-
 Italy
Italy
-
 Jamaica
-
 Japan
Japan
-
 Jordan
-
 Kazakhstan
-
 Kenya
Kenya
-
 Korea
Korea
-
 Kuwait
-
 Kyrgyzstan
-
 Laos
Laos
-
 Latvia
-
 Lebanon
-
 Lesotho
-
 Libya
Libya
-
 Lithuania
-
 Luxembourg
-
 Madagascar
-
 Malaysia
-
 Malta
Malta
-
 Mauritius
-
 Mexico
-
 Moldova
-
 Mongolia
-
 Montenegro
-
 Morocco
-
 Mozambique
-
 Myanmar
-
 Namibia
-
 Nepal
Nepal
-
 Netherlands
-
 New Zealand
-
 Nigeria
-
 North Macedonia
-
 Norway
-
 Oman
Oman
-
 Pakistan
-
 Palestine
-
 Panama
-
 Papua New Guinea
-
 Paraguay
-
 Peru
Peru
-
 Philippines
-
 Poland
-
 Portugal
-
 Puerto Rico
-
 Qatar
Qatar
-
 Reunion
-
 Romania
-
 Rwanda
-
 Saudi Arabia
-
 Serbia
-
 Singapore
-
 Slovakia
-
 Slovenia
-
 Somalia
-
 South Africa
-
 Spain
Spain
-
 Sri Lanka
-
 Sweden
-
 Switzerland
-
 Syria
Syria
-
 Taiwan
-
 Tajikistan
-
 Tanzania
-
 Thailand
-
 Trinidad and Tobago
-
 Tunisia
-
 Turkey
-
 UAE
UAE
-
 Uganda
-
 Ukraine
-
 United Kingdom
-
United States
-
 Uruguay
-
 Uzbekistan
-
 Venezuela
-
 Vietnam
-
 Yemen
Yemen
-
 Zambia
-
 Zimbabwe
- Forex
- Crypto
