
-1.12% for MercadoLibre stock — resistance holds despite bullish fintech news

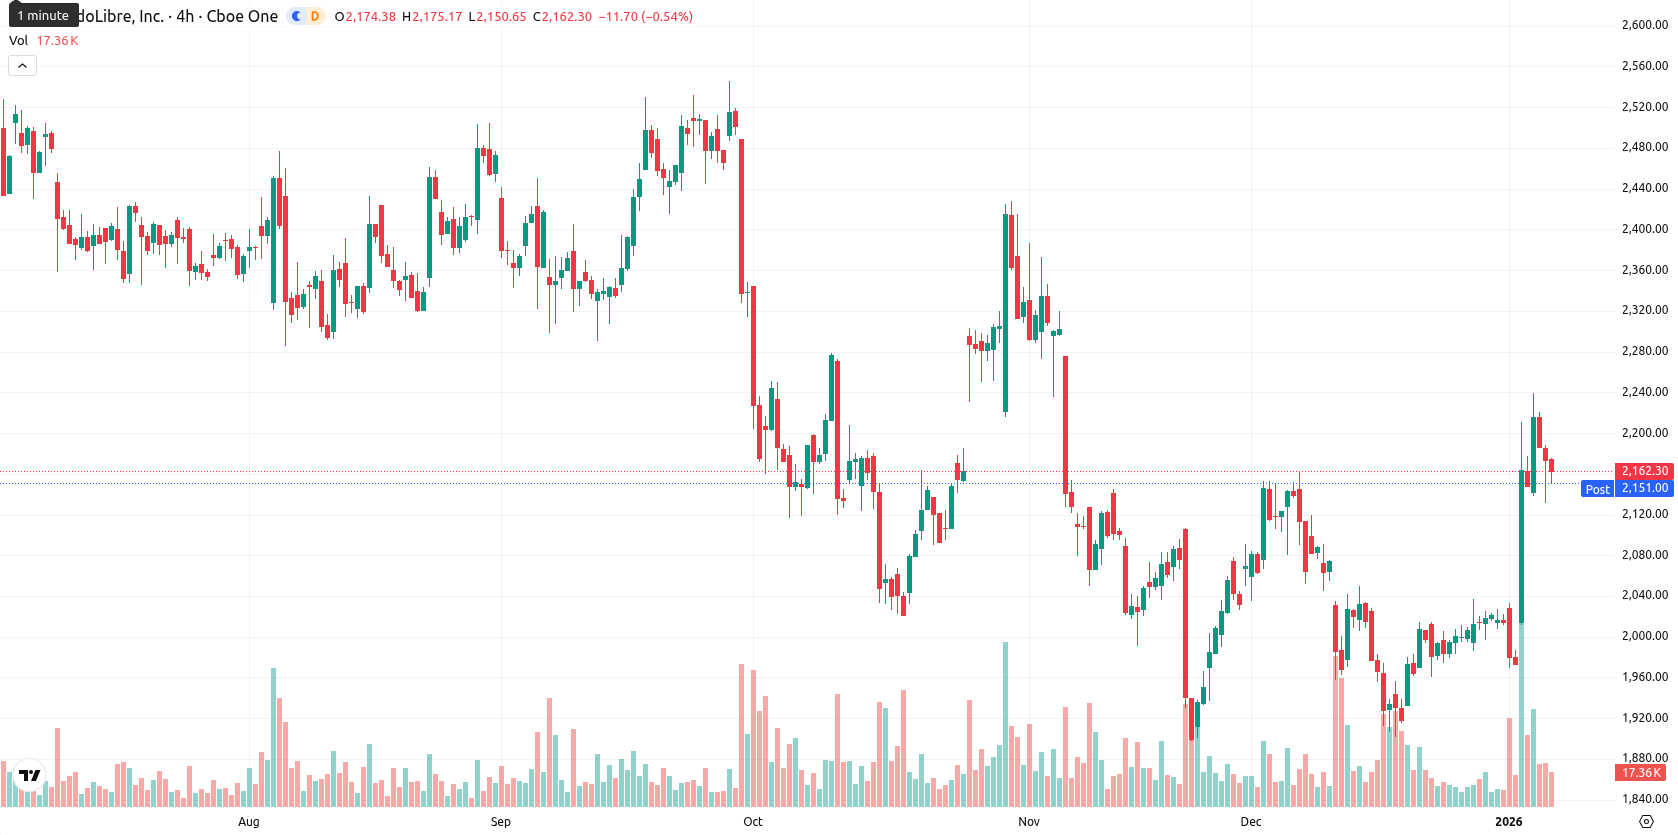
MercadoLibre Inc (MELI) is trading at $2,162.61, positioned above both the MA-20 ($2,015.01) and MA-50 ($2,085.49), while still below the MA-200 ($2,268.76). This setup highlights strong short- and medium-term momentum even as longer-term resistance persists.
Highlights
- MercadoLibre reinforced its Latin American e-commerce and fintech dominance by rolling out AI-powered fraud detection and advanced credit scoring capabilities.
- Mercado Pago became the most used credit card in Brazil, significantly increasing transaction volumes and boosting advertising income for MercadoLibre.
- DSM Capital Partners LLC increased its stake in MercadoLibre by purchasing 1,580 additional shares in the third quarter, indicating rising institutional interest.
Institutional inflows grow as fintech innovation and leadership expand
MercadoLibre continued to strengthen its leadership in Latin American e-commerce and fintech with notable innovations such as AI-powered fraud detection and advanced credit scoring. The company’s payment platform, Mercado Pago, became the most used credit card in Brazil, boosting transaction volumes and advertising income. Additionally, DSM Capital Partners LLC increased its holdings in MercadoLibre by acquiring 1,580 more shares in the third quarter, reflecting growing institutional interest.
Rangebound action emerges as mixed momentum signals and overbought readings clash
MELI’s technical picture reveals the nearest dynamic support at the Ichimoku Kijun ($2,070.88) and resistance around the MA-50 and the recent high near $2,188. Momentum indicators are mixed: the MACD is neutral on the daily chart, ADX shows weak trend strength, while the RSI (64.78), Stochastic RSI (100.00), and CCI (272.40) indicate overbought conditions. Bull/Bear Power signals intraday buying dominance, but the Awesome Oscillator provides little confirmation of trend strength. The stock slipped 1.12% today with a modest opening gap and traded near the middle of its range after experiencing mild intraday volatility, reflecting early buying that has moderated.
Sideways trade likely as breakout risks hinge on key technical levels
Over the next five trading days, MELI is expected to fluctuate within the $2,085 – $2,190 volatility band relative to current levels. The probability of further gains is moderate (about 50%), with downside risk present given the neutral MACD and ADX signals on the weekly chart. Sideways consolidation between $2,085 and $2,190 is the baseline scenario. A bullish breakout above $2,190 could prompt a new rally, while a drop below support at $2,085 might lead to additional selling toward the $2,050 area.
Last time, analysts noted that MercadoLibre Inc. was exhibiting short- to medium-term bullish momentum as the price traded above the MA-20 and MA-50 but remained below the MA-200, with resistance at $2,200 and dynamic support near the Ichimoku Kijun. While RSI and the Awesome Oscillator confirmed the upward move, oscillators such as Stoch RSI and CCI pointed to overbought conditions and technical indicators including MACD and ADX signaled the risk of a near-term pullback amidst heightened volatility.


Latest MercadoLibre News


-
 Afghanistan
-
 Albania
-
 Algeria
-
 Angola
-
 Argentina
-
 Armenia
-
 Australia
-
 Austria
-
 Azerbaijan
-
 Bahamas
-
 Bahrain
-
 Bangladesh
-
 Belarus
-
 Belgium
-
 Bolivia
-
 Botswana
-
 Brazil
-
 Brunei
-
 Bulgaria
-
 Cambodia
-
 Cameroon
-
 Canada
-
 Chile
Chile
-
 China
China
-
 Colombia
-
 Congo
Congo
-
 Costa Rica
-
 Cote d'Ivoire
-
 Croatia
-
 Cuba
Cuba
-
 Cyprus
-
 Czechia
-
 DR Congo
-
 Denmark
-
 Dominican Republic
-
 Ecuador
-
 Egypt
Egypt
-
 El Salvador
-
 Estonia
-
 Eswatini
-
 Ethiopia
-
 Finland
-
 France
-
 Georgia
-
 Germany
-
 Ghana
Ghana
-
 Greece
-
 Haiti
Haiti
-
 Hong Kong
-
 Hungary
-
 India
India
-
 Indonesia
-
 Iran, Islamic republic
-
 Iraq
Iraq
-
 Ireland
-
 Israel
-
 Italy
Italy
-
 Jamaica
-
 Japan
Japan
-
 Jordan
-
 Kazakhstan
-
 Kenya
Kenya
-
 Korea
Korea
-
 Kuwait
-
 Kyrgyzstan
-
 Laos
Laos
-
 Latvia
-
 Lebanon
-
 Lesotho
-
 Libya
Libya
-
 Lithuania
-
 Luxembourg
-
 Madagascar
-
 Malaysia
-
 Malta
Malta
-
 Mauritius
-
 Mexico
-
 Moldova
-
 Mongolia
-
 Montenegro
-
 Morocco
-
 Mozambique
-
 Myanmar
-
 Namibia
-
 Nepal
Nepal
-
 Netherlands
-
 New Zealand
-
 Nigeria
-
 North Macedonia
-
 Norway
-
 Oman
Oman
-
 Pakistan
-
 Palestine
-
 Panama
-
 Papua New Guinea
-
 Paraguay
-
 Peru
Peru
-
 Philippines
-
 Poland
-
 Portugal
-
 Puerto Rico
-
 Qatar
Qatar
-
 Reunion
-
 Romania
-
 Rwanda
-
 Saudi Arabia
-
 Serbia
-
 Singapore
-
 Slovakia
-
 Slovenia
-
 Somalia
-
 South Africa
-
 Spain
Spain
-
 Sri Lanka
-
 Sweden
-
 Switzerland
-
 Syria
Syria
-
 Taiwan
-
 Tajikistan
-
 Tanzania
-
 Thailand
-
 Trinidad and Tobago
-
 Tunisia
-
 Turkey
-
 UAE
UAE
-
 Uganda
-
 Ukraine
-
 United Kingdom
-
United States
-
 Uruguay
-
 Uzbekistan
-
 Venezuela
-
 Vietnam
-
 Yemen
Yemen
-
 Zambia
-
 Zimbabwe
- Forex
- Crypto
