
Costco Wholesale weekly review: bullish momentum persists — faces MA-50 resistance at $955.59

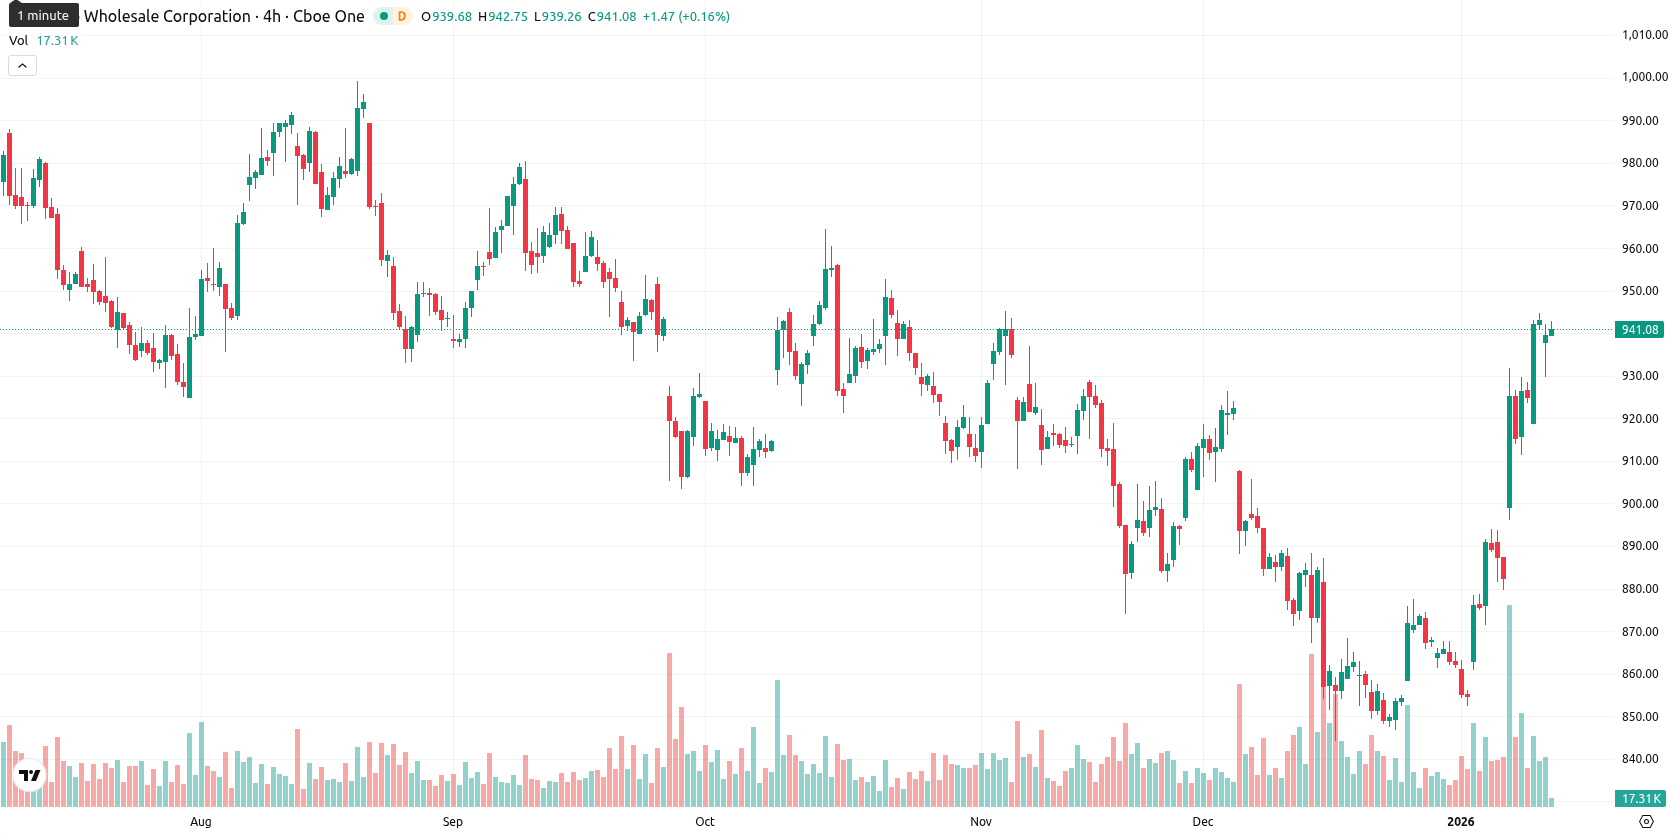
Costco Wholesale Corporation (COST) closed the week at $939.64, up $14.54 or 1.66% over the past seven days. The price remains above its weekly MA-20 at $915.64 but below the MA-50 at $955.59, reflecting short-term bullish momentum with medium-term resistance in sight on the weekly chart.
Highlights
- Costco's December net sales rose 8.5% year over year to $29.86 billion, with year-to-date net sales reaching $101.83 billion, an 8.3% increase.
- Membership renewal rates stayed high at approximately 90%, Executive membership upgrades increased, and the company paid a $1.30 quarterly dividend per share.
- Costco faces ongoing risks from higher labor costs, foreign exchange volatility, US supply chain shifts, a tariff-related lawsuit, and mixed insider activity.
Solid sales and strong renewals drive sentiment despite operational risks
Costco reported strong December results, with net sales rising 8.5% year over year to $29.86 billion and year-to-date net sales reaching $101.83 billion, an 8.3% increase over the prior period. Membership renewal rates stayed high at roughly 90%, and more customers upgraded to Executive memberships, supporting the company's recurring revenue model. Costco maintained its dividend payout with a recent quarterly dividend of $1.30 per share. The company also navigates ongoing risks from higher labor costs, foreign exchange volatility, supply chain shifts to more U.S.-made goods, a tariff-related lawsuit, and recent mixed insider activity.
Mixed momentum and overbought signals sustain weekly volatility
Weekly technical analysis shows Costco elevated above short-term support at the MA-20 ($915.64) and the Ichimoku Kijun near $921.68, but still trading below the MA-50 resistance at $955.59. The MA-200 stands as long-term support far below current levels. Weekly momentum indicators are mixed: RSI and CCI both signal bullishness, Stoch RSI and BBP show overbought conditions, MACD points to strong selling, ADX is neutral and weak, and the Awesome Oscillator does not confirm the uptrend. The weekly range between $879.62 and $944.83 highlights continued high volatility and the tug-of-war between buyers and sellers.
Lateral bias expected as mixed signals cap breakout risk next week
In the coming 5–7 trading days, price action is likely to fluctuate between $920.00 and $960.00, tracking support at $921.00 and facing resistance at $955.00. Mixed weekly signals limit the probability of a breakout, with momentum favoring sideways or modestly lower movement. If price breaks above $955.00, further gains could be unlocked; a drop below $921.00 may prompt a deeper retracement toward the lower end of the weekly range. Sideways consolidation is the baseline scenario given the current technical setup.
Previously it was noted that Costco exhibited ongoing bullish momentum above its short- and medium-term moving averages, while buyers dominated in the face of mixed momentum signals. The prior report highlighted diverging short-term technicals and warned that short-term profit-taking and consolidation appear probable.


-
 Afghanistan
-
 Albania
-
 Algeria
-
 Angola
-
 Argentina
-
 Armenia
-
 Australia
-
 Austria
-
 Azerbaijan
-
 Bahamas
-
 Bahrain
-
 Bangladesh
-
 Belarus
-
 Belgium
-
 Bolivia
-
 Botswana
-
 Brazil
-
 Brunei
-
 Bulgaria
-
 Cambodia
-
 Cameroon
-
 Canada
-
 Chile
Chile
-
 China
China
-
 Colombia
-
 Congo
Congo
-
 Costa Rica
-
 Cote d'Ivoire
-
 Croatia
-
 Cuba
Cuba
-
 Cyprus
-
 Czechia
-
 DR Congo
-
 Denmark
-
 Dominican Republic
-
 Ecuador
-
 Egypt
Egypt
-
 El Salvador
-
 Estonia
-
 Eswatini
-
 Ethiopia
-
 Finland
-
 France
-
 Georgia
-
 Germany
-
 Ghana
Ghana
-
 Greece
-
 Haiti
Haiti
-
 Hong Kong
-
 Hungary
-
 India
India
-
 Indonesia
-
 Iran, Islamic republic
-
 Iraq
Iraq
-
 Ireland
-
 Israel
-
 Italy
Italy
-
 Jamaica
-
 Japan
Japan
-
 Jordan
-
 Kazakhstan
-
 Kenya
Kenya
-
 Korea
Korea
-
 Kuwait
-
 Kyrgyzstan
-
 Laos
Laos
-
 Latvia
-
 Lebanon
-
 Lesotho
-
 Libya
Libya
-
 Lithuania
-
 Luxembourg
-
 Madagascar
-
 Malaysia
-
 Malta
Malta
-
 Mauritius
-
 Mexico
-
 Moldova
-
 Mongolia
-
 Montenegro
-
 Morocco
-
 Mozambique
-
 Myanmar
-
 Namibia
-
 Nepal
Nepal
-
 Netherlands
-
 New Zealand
-
 Nigeria
-
 North Macedonia
-
 Norway
-
 Oman
Oman
-
 Pakistan
-
 Palestine
-
 Panama
-
 Papua New Guinea
-
 Paraguay
-
 Peru
Peru
-
 Philippines
-
 Poland
-
 Portugal
-
 Puerto Rico
-
 Qatar
Qatar
-
 Reunion
-
 Romania
-
 Rwanda
-
 Saudi Arabia
-
 Serbia
-
 Singapore
-
 Slovakia
-
 Slovenia
-
 Somalia
-
 South Africa
-
 Spain
Spain
-
 Sri Lanka
-
 Sweden
-
 Switzerland
-
 Syria
Syria
-
 Taiwan
-
 Tajikistan
-
 Tanzania
-
 Thailand
-
 Trinidad and Tobago
-
 Tunisia
-
 Turkey
-
 UAE
UAE
-
 Uganda
-
 Ukraine
-
 United Kingdom
-
United States
-
 Uruguay
-
 Uzbekistan
-
 Venezuela
-
 Vietnam
-
 Yemen
Yemen
-
 Zambia
-
 Zimbabwe
- Forex
- Crypto
