
Costco stock: mixed technicals and profit-taking drive pullback near all-time highs

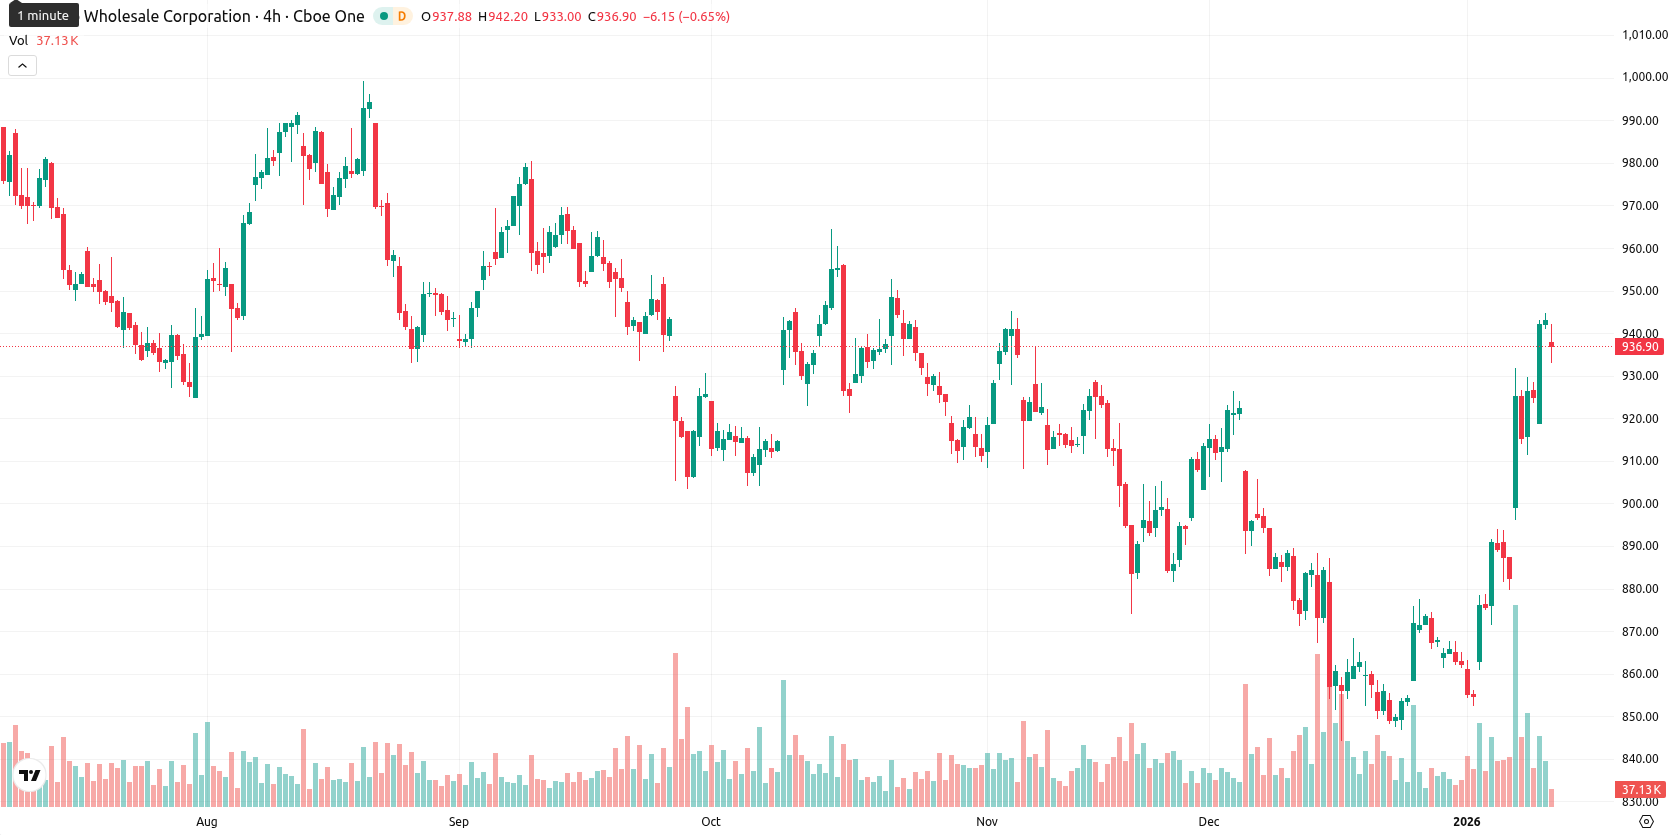
Costco Wholesale Corporation (COST) is currently trading at $936.39, which places it firmly above the MA-20 ($875.66) and MA-50 ($895.20) but just below the MA-200 ($950.31), signaling strength in the short to medium term with some longer-term resistance overhead. Today's session shows a mild decline of 0.74%, opening slightly below the previous close without a significant gap, and the price is mid-range in today's trade, reflecting moderate volatility with an overall tone of gentle pullback after recent strength.
Highlights
- Costco saw multiple investment firms increase their holdings in the third quarter, while Executive Vice President Russell Miller sold 1,500 shares for about $1.37 million and still retains stakes.
- Costco maintains solid financial health, with more cash than debt, 22 consecutive years of dividends, and an annual dividend currently at $5.20 per share.
- Quarterly revenue rose 8.3% year-over-year, with January sales reporting scheduled for February 4 and fiscal second-quarter earnings set for March 5.
Insider selling and fund inflows amid stable financial performance
Costco saw increased holdings from multiple investment firms during the third quarter, while Executive Vice President Russell Miller conducted an insider sale of 1,500 shares valued at roughly $1.37 million, retaining direct and indirect stakes post-transaction. Despite this sale, Costco continues to demonstrate solid financial health with more cash than debt, 22 consecutive years of dividends currently paid at $5.20 per share annually, and an 8.3% year-over-year rise in quarterly revenue. The company has also scheduled January sales reporting for February 4 and its fiscal second-quarter earnings release for March 5, 2026.
Bullish momentum meets overbought signals as support holds
Momentum signals are mixed: daily MACD is neutral and ADX on D1 leans to the buy side, suggesting only moderate trend strength. Both the RSI (70.51) and CCI (237.34) are in overbought territory, as is Stochastic RSI, while Bull/Bear Power indicates buyers currently dominate. The Awesome Oscillator supports the ongoing bullish bias. The nearest support is found at the Ichimoku Kijun level of $894.42, while the MA-50 around $895.20 and the psychological level near $950.00 act as key resistance zones. Divergence between short-term overbought oscillators and ongoing bullish momentum highlights the risk of near-term consolidation or a modest pullback.
Downside risks grow as near-term range and overbought signals persist
For the week ahead, COST is expected to fluctuate within a $913.00–$950.00 volatility band relative to current levels. The probability of a price increase is very low (less than 20%), suggesting a further decline is more likely. The baseline outlook is for continued sideways movement within this range; a bullish scenario would require a break above $950.00 with sustained buying, while a drop below $913.00 could trigger a deeper correction. Given overbought readings and mixed weekly momentum, short-term profit-taking and consolidation appear probable.
Previously it was reported that Costco continues to show strong bullish momentum above its short- and medium-term moving averages, while remaining constrained by long-term resistance near the MA-200. Despite firm buyer demand and a bullish RSI, overbought oscillator signals and neutral momentum indicators point to likely price consolidation with a modest risk of short-term fatigue.


-
 Afghanistan
-
 Albania
-
 Algeria
-
 Angola
-
 Argentina
-
 Armenia
-
 Australia
-
 Austria
-
 Azerbaijan
-
 Bahamas
-
 Bahrain
-
 Bangladesh
-
 Belarus
-
 Belgium
-
 Bolivia
-
 Botswana
-
 Brazil
-
 Brunei
-
 Bulgaria
-
 Cambodia
-
 Cameroon
-
 Canada
-
 Chile
Chile
-
 China
China
-
 Colombia
-
 Congo
Congo
-
 Costa Rica
-
 Cote d'Ivoire
-
 Croatia
-
 Cuba
Cuba
-
 Cyprus
-
 Czechia
-
 DR Congo
-
 Denmark
-
 Dominican Republic
-
 Ecuador
-
 Egypt
Egypt
-
 El Salvador
-
 Estonia
-
 Eswatini
-
 Ethiopia
-
 Finland
-
 France
-
 Georgia
-
 Germany
-
 Ghana
Ghana
-
 Greece
-
 Haiti
Haiti
-
 Hong Kong
-
 Hungary
-
 India
India
-
 Indonesia
-
 Iran, Islamic republic
-
 Iraq
Iraq
-
 Ireland
-
 Israel
-
 Italy
Italy
-
 Jamaica
-
 Japan
Japan
-
 Jordan
-
 Kazakhstan
-
 Kenya
Kenya
-
 Korea
Korea
-
 Kuwait
-
 Kyrgyzstan
-
 Laos
Laos
-
 Latvia
-
 Lebanon
-
 Lesotho
-
 Libya
Libya
-
 Lithuania
-
 Luxembourg
-
 Madagascar
-
 Malaysia
-
 Malta
Malta
-
 Mauritius
-
 Mexico
-
 Moldova
-
 Mongolia
-
 Montenegro
-
 Morocco
-
 Mozambique
-
 Myanmar
-
 Namibia
-
 Nepal
Nepal
-
 Netherlands
-
 New Zealand
-
 Nigeria
-
 North Macedonia
-
 Norway
-
 Oman
Oman
-
 Pakistan
-
 Palestine
-
 Panama
-
 Papua New Guinea
-
 Paraguay
-
 Peru
Peru
-
 Philippines
-
 Poland
-
 Portugal
-
 Puerto Rico
-
 Qatar
Qatar
-
 Reunion
-
 Romania
-
 Rwanda
-
 Saudi Arabia
-
 Serbia
-
 Singapore
-
 Slovakia
-
 Slovenia
-
 Somalia
-
 South Africa
-
 Spain
Spain
-
 Sri Lanka
-
 Sweden
-
 Switzerland
-
 Syria
Syria
-
 Taiwan
-
 Tajikistan
-
 Tanzania
-
 Thailand
-
 Trinidad and Tobago
-
 Tunisia
-
 Turkey
-
 UAE
UAE
-
 Uganda
-
 Ukraine
-
 United Kingdom
-
United States
-
 Uruguay
-
 Uzbekistan
-
 Venezuela
-
 Vietnam
-
 Yemen
Yemen
-
 Zambia
-
 Zimbabwe
- Forex
- Crypto
