

Costco stock hovers above key support at $946.42 as short-term weakness prevails: weekly review

Costco Wholesale Corporation (COST) is currently priced at $965.43, declining below the weekly MA-20 at $996.63 yet remaining just above the MA-50 at $958.00 and well above the MA-200 at $768.40. Over the past week, the stock rose $8.41, or 0.68%, but trades near the lower end of its weekly range and shows ongoing medium-term selling pressure while the longer-term trend finds support at higher moving averages.
 960.70
960.70
960.70
Highlights
- Costco is experiencing medium-term selling pressure with price action confined below short-term moving averages and limited upward momentum.
- Oscillator signals indicate dominant selling, oversold conditions, and weak trend strength, despite a modest recent price uptick.
- The expected 7-day trading range is $946.42 to $958.50, with downside favored unless a breakout above resistance triggers renewed bullish momentum.
Dividend hike and resilient revenue as margin pressures persist this week
Costco reported its third-quarter results for the period ending May 10, 2026, with revenue of $70.53 billion and net income of $2.19 billion, highlighting strong gasoline volumes and notable gains in the wellness category. The company raised its dividend by 13% to $1.47 per share and remains focused on growing its member base while maintaining a value-driven approach. Additionally, Costco continues to address margin pressures and has reinforced its commitment to returning capital to shareholders through dividends and share buybacks.
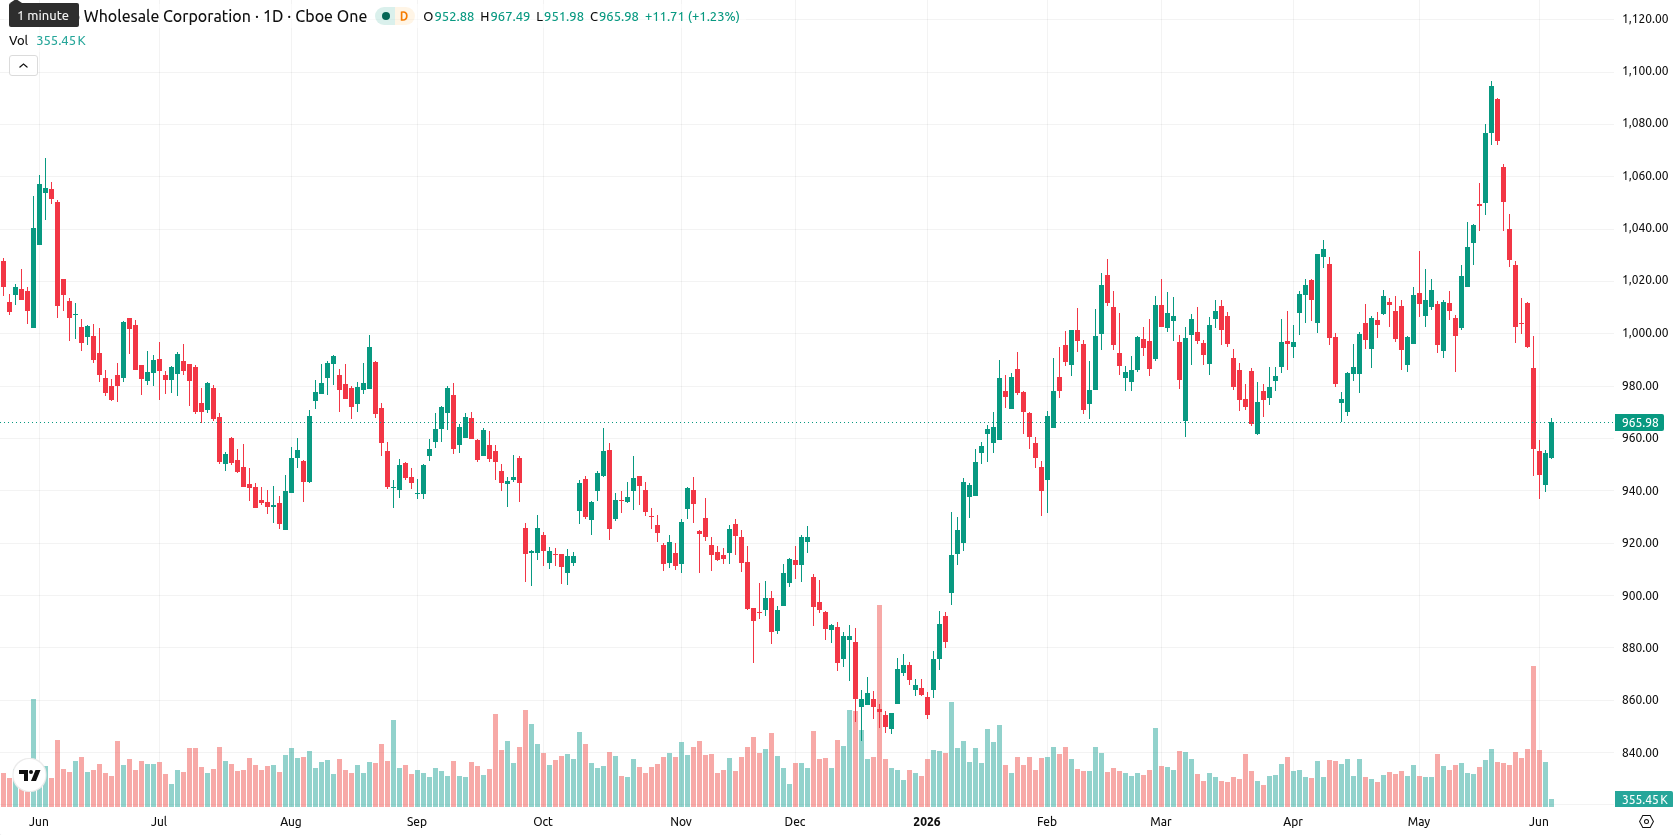
Short-term weakness signaled as weekly oscillators remain bearish
On the weekly chart, COST remains held by dynamic support at its MA-50 ($958.00) but sits under MA-20 ($996.63), signaling persistent short-term weakness. Weekly oscillators are broadly bearish, with the RSI at a muted 45.28 and multiple oversold signals issued by the CCI, Stochastic RSI, and Bull/Bear Power. The MACD, however, gives a contrary strong buy signal, while the ADX reflects a weak, neutral trend. Support rests at $946.42 and initial resistance stands at $958.50, with weekly volatility at 8.06%.
Rangebound outlook and downside risk as sellers dominate next week
For the next five trading days, Costco is expected to consolidate between $946.42 and $958.50, barring a clear directional break. Weekly indicator alignment suggests sellers have the upper hand, supported by oversold readings and little upward momentum, so further downside cannot be ruled out unless a bullish move above resistance is confirmed. A sideways movement within this range is the baseline scenario, while a breach below $946.42 would likely result in increased downside pressure. Conversely, confirmation of momentum with a close above $958.50 could prompt a short-term rebound.
Earlier, analysts noted that U.S. retailers were seeing increasingly selective consumer spending and heightened pressure on lower-income households due to persistently high fuel costs and ongoing inflation concerns. In light of Costco’s recent resilience in key business segments and its ability to attract value-seeking consumers, any decisive move above or below the $946.42–$958.50 range should be monitored as a potential signal for the next directional trend.











-
 Afghanistan
-
 Albania
-
 Algeria
-
 Angola
-
 Argentina
-
 Armenia
-
 Australia
-
 Austria
-
 Azerbaijan
-
 Bahamas
-
 Bahrain
-
 Bangladesh
-
 Belarus
-
 Belgium
-
 Bolivia
-
 Botswana
-
 Brazil
-
 Brunei
-
 Bulgaria
-
 Cambodia
-
 Cameroon
-
 Canada
-
 Chile
Chile
-
 China
China
-
 Colombia
-
 Congo
Congo
-
 Costa Rica
-
 Cote d'Ivoire
-
 Croatia
-
 Cuba
Cuba
-
 Cyprus
-
 Czechia
-
 DR Congo
-
 Denmark
-
 Dominican Republic
-
 Ecuador
-
 Egypt
Egypt
-
 El Salvador
-
 Estonia
-
 Eswatini
-
 Ethiopia
-
 Finland
-
 France
-
 Georgia
-
 Germany
-
 Ghana
Ghana
-
 Greece
-
 Haiti
Haiti
-
 Hong Kong
-
 Hungary
-
 India
India
-
 Indonesia
-
 Iran, Islamic republic
-
 Iraq
Iraq
-
 Ireland
-
 Israel
-
 Italy
Italy
-
 Jamaica
-
 Japan
Japan
-
 Jordan
-
 Kazakhstan
-
 Kenya
Kenya
-
 Korea
Korea
-
 Kuwait
-
 Kyrgyzstan
-
 Laos
Laos
-
 Latvia
-
 Lebanon
-
 Lesotho
-
 Libya
Libya
-
 Lithuania
-
 Luxembourg
-
 Madagascar
-
 Malaysia
-
 Malta
Malta
-
 Mauritius
-
 Mexico
-
 Moldova
-
 Mongolia
-
 Montenegro
-
 Morocco
-
 Mozambique
-
 Myanmar
-
 Namibia
-
 Nepal
Nepal
-
 Netherlands
-
 New Zealand
-
 Nigeria
-
 North Macedonia
-
 Norway
-
 Oman
Oman
-
 Pakistan
-
 Palestine
-
 Panama
-
 Papua New Guinea
-
 Paraguay
-
 Peru
Peru
-
 Philippines
-
 Poland
-
 Portugal
-
 Puerto Rico
-
 Qatar
Qatar
-
 Reunion
-
 Romania
-
 Rwanda
-
 Saudi Arabia
-
 Serbia
-
 Singapore
-
 Slovakia
-
 Slovenia
-
 Somalia
-
 South Africa
-
 Spain
Spain
-
 Sri Lanka
-
 Sweden
-
 Switzerland
-
 Syria
Syria
-
 Taiwan
-
 Tajikistan
-
 Tanzania
-
 Thailand
-
 Trinidad and Tobago
-
 Tunisia
-
 Turkey
-
 UAE
UAE
-
 Uganda
-
 Ukraine
-
 United Kingdom
-
United States
-
 Uruguay
-
 Uzbekistan
-
 Venezuela
-
 Vietnam
-
 Yemen
Yemen
-
 Zambia
-
 Zimbabwe
- Forex
- Crypto












