
Costco stock holds above MA-50 support amid mixed oscillator signals: weekly analysis

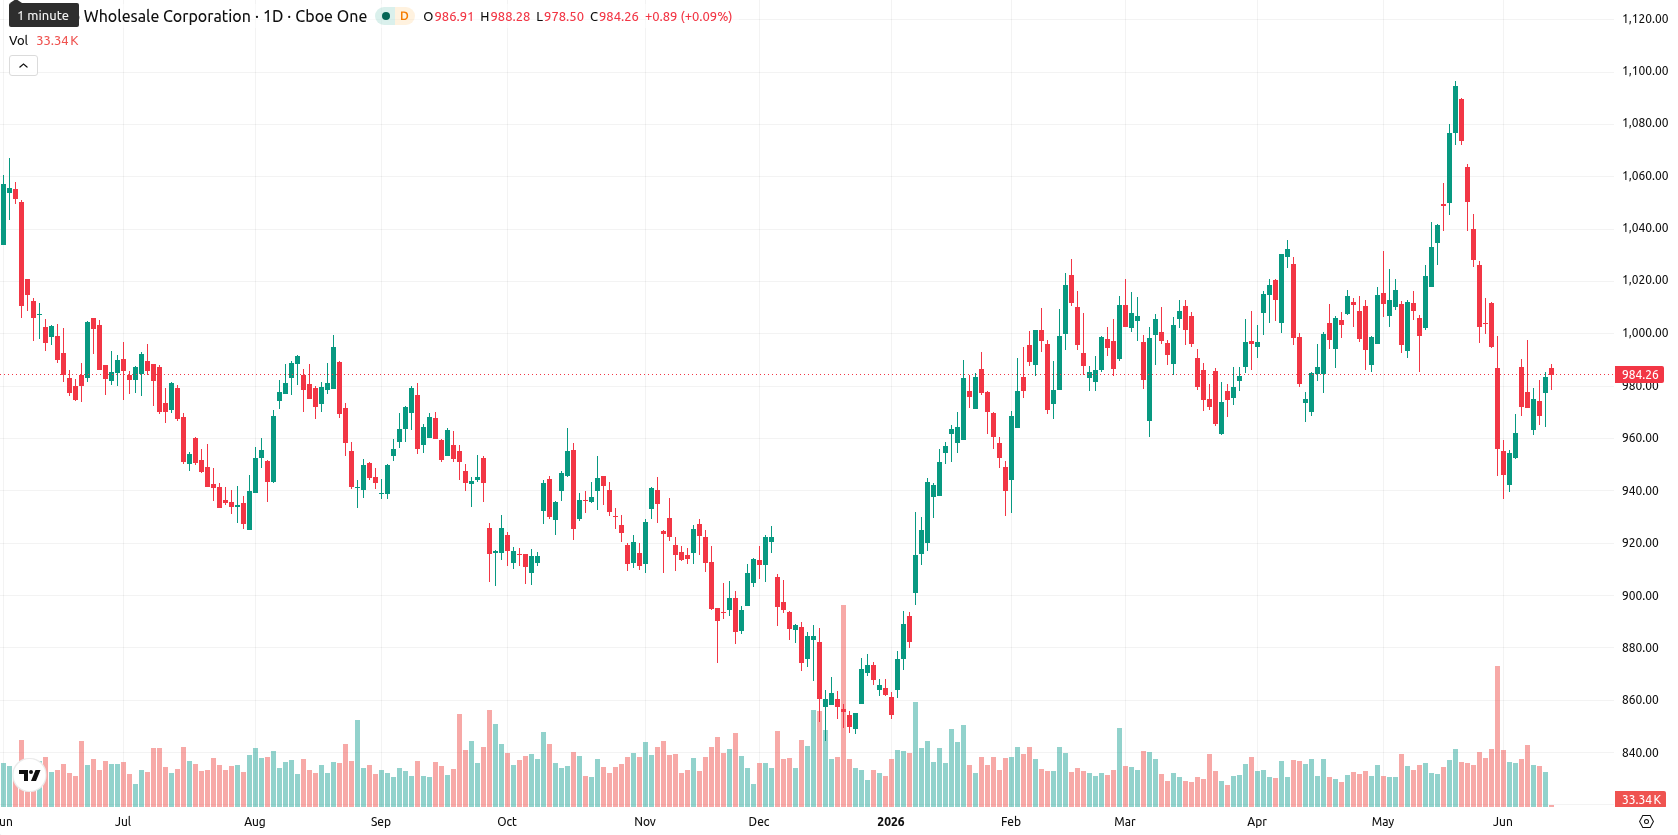
Costco Wholesale Corporation (COST) is currently trading at $980.77, having gained $11.53 (1.36%) over the past week. The stock trades below its weekly MA-20 of $997.39, but remains above the MA-50 at $958.28 and the MA-200 at $770.71, indicating short-term resistance but medium- and long-term support, with a moderate rebound off support levels in the weekly range.
Highlights
- Costco remains in a broad uptrend with prices above medium- and long-term support but encountering short-term resistance.
- Momentum signals are mixed, with ongoing bullishness offset by weak trend strength and stronger short-term selling pressure.
- Next week's expected trading range is $976.92 to $1,014.81, with stabilization likely unless momentum decisively shifts in either direction.
Revenue beat offsets EPS miss as dividend hike and institutions lift sentiment
Costco reported quarterly revenue of $70.53 billion, surpassing analyst expectations, though its earnings per share of $4.93 were just below consensus by one cent. The company also announced a quarterly dividend increase from $1.30 to $1.47 per share, set for distribution on May 15th. Institutional ownership has seen recent growth as well, with Signet Private Wealth LLC acquiring 524 shares valued at approximately $452,000 last quarter.
Mixed momentum as oscillators diverge between resistance and support over the week
On the weekly chart, COST sits between support from the MA-50 and resistance from the MA-20, while remaining well above its long-term MA-200. The weekly MACD signals strong bullish momentum, whereas the ADX is subdued at 12.56, indicating a weak trend. Oscillators are mixed, with the Stochastic RSI and RSI suggesting mild buying potential, but the Commodity Channel Index and Bull/Bear Power showing slight selling pressure and a short-term seller edge. Support is noted near $977, with resistance near $1,015 as weekly volatility registers at 3.77%.
Rangebound outlook with breakout risk as momentum indicators conflict for coming week
Over the next five trading days, COST is expected to fluctuate between $976.92 and $1,014.81. A balanced outlook prevails, with a roughly even chance of an upward or downward move since two out of four momentum indicators signal buy or strong buy. The base case scenario sees the price stabilizing between weekly support at $977 and resistance at $1,015. If bullish momentum strengthens, a move above $1,015 is possible, whereas a break below support could trigger a decline toward $977, though significant support is likely to limit sharper losses.
Previously it was reported that Costco was experiencing persistent short-term selling pressure while maintaining longer-term strength, with sellers holding the upper hand in the near term. The current technical setup and momentum readings suggest a shift to a more balanced outlook, so investors should monitor for a decisive break above $1,015 or below $977 as a potential signal for the next directional move.


-
 Afghanistan
-
 Albania
-
 Algeria
-
 Angola
-
 Argentina
-
 Armenia
-
 Australia
-
 Austria
-
 Azerbaijan
-
 Bahamas
-
 Bahrain
-
 Bangladesh
-
 Belarus
-
 Belgium
-
 Bolivia
-
 Botswana
-
 Brazil
-
 Brunei
-
 Bulgaria
-
 Cambodia
-
 Cameroon
-
 Canada
-
 Chile
Chile
-
 China
China
-
 Colombia
-
 Congo
Congo
-
 Costa Rica
-
 Cote d'Ivoire
-
 Croatia
-
 Cuba
Cuba
-
 Cyprus
-
 Czechia
-
 DR Congo
-
 Denmark
-
 Dominican Republic
-
 Ecuador
-
 Egypt
Egypt
-
 El Salvador
-
 Estonia
-
 Eswatini
-
 Ethiopia
-
 Finland
-
 France
-
 Georgia
-
 Germany
-
 Ghana
Ghana
-
 Greece
-
 Haiti
Haiti
-
 Hong Kong
-
 Hungary
-
 India
India
-
 Indonesia
-
 Iran, Islamic republic
-
 Iraq
Iraq
-
 Ireland
-
 Israel
-
 Italy
Italy
-
 Jamaica
-
 Japan
Japan
-
 Jordan
-
 Kazakhstan
-
 Kenya
Kenya
-
 Korea
Korea
-
 Kuwait
-
 Kyrgyzstan
-
 Laos
Laos
-
 Latvia
-
 Lebanon
-
 Lesotho
-
 Libya
Libya
-
 Lithuania
-
 Luxembourg
-
 Madagascar
-
 Malaysia
-
 Malta
Malta
-
 Mauritius
-
 Mexico
-
 Moldova
-
 Mongolia
-
 Montenegro
-
 Morocco
-
 Mozambique
-
 Myanmar
-
 Namibia
-
 Nepal
Nepal
-
 Netherlands
-
 New Zealand
-
 Nigeria
-
 North Macedonia
-
 Norway
-
 Oman
Oman
-
 Pakistan
-
 Palestine
-
 Panama
-
 Papua New Guinea
-
 Paraguay
-
 Peru
Peru
-
 Philippines
-
 Poland
-
 Portugal
-
 Puerto Rico
-
 Qatar
Qatar
-
 Reunion
-
 Romania
-
 Rwanda
-
 Saudi Arabia
-
 Serbia
-
 Singapore
-
 Slovakia
-
 Slovenia
-
 Somalia
-
 South Africa
-
 Spain
Spain
-
 Sri Lanka
-
 Sweden
-
 Switzerland
-
 Syria
Syria
-
 Taiwan
-
 Tajikistan
-
 Tanzania
-
 Thailand
-
 Trinidad and Tobago
-
 Tunisia
-
 Turkey
-
 UAE
UAE
-
 Uganda
-
 Ukraine
-
 United Kingdom
-
United States
-
 Uruguay
-
 Uzbekistan
-
 Venezuela
-
 Vietnam
-
 Yemen
Yemen
-
 Zambia
-
 Zimbabwe
- Forex
- Crypto
