
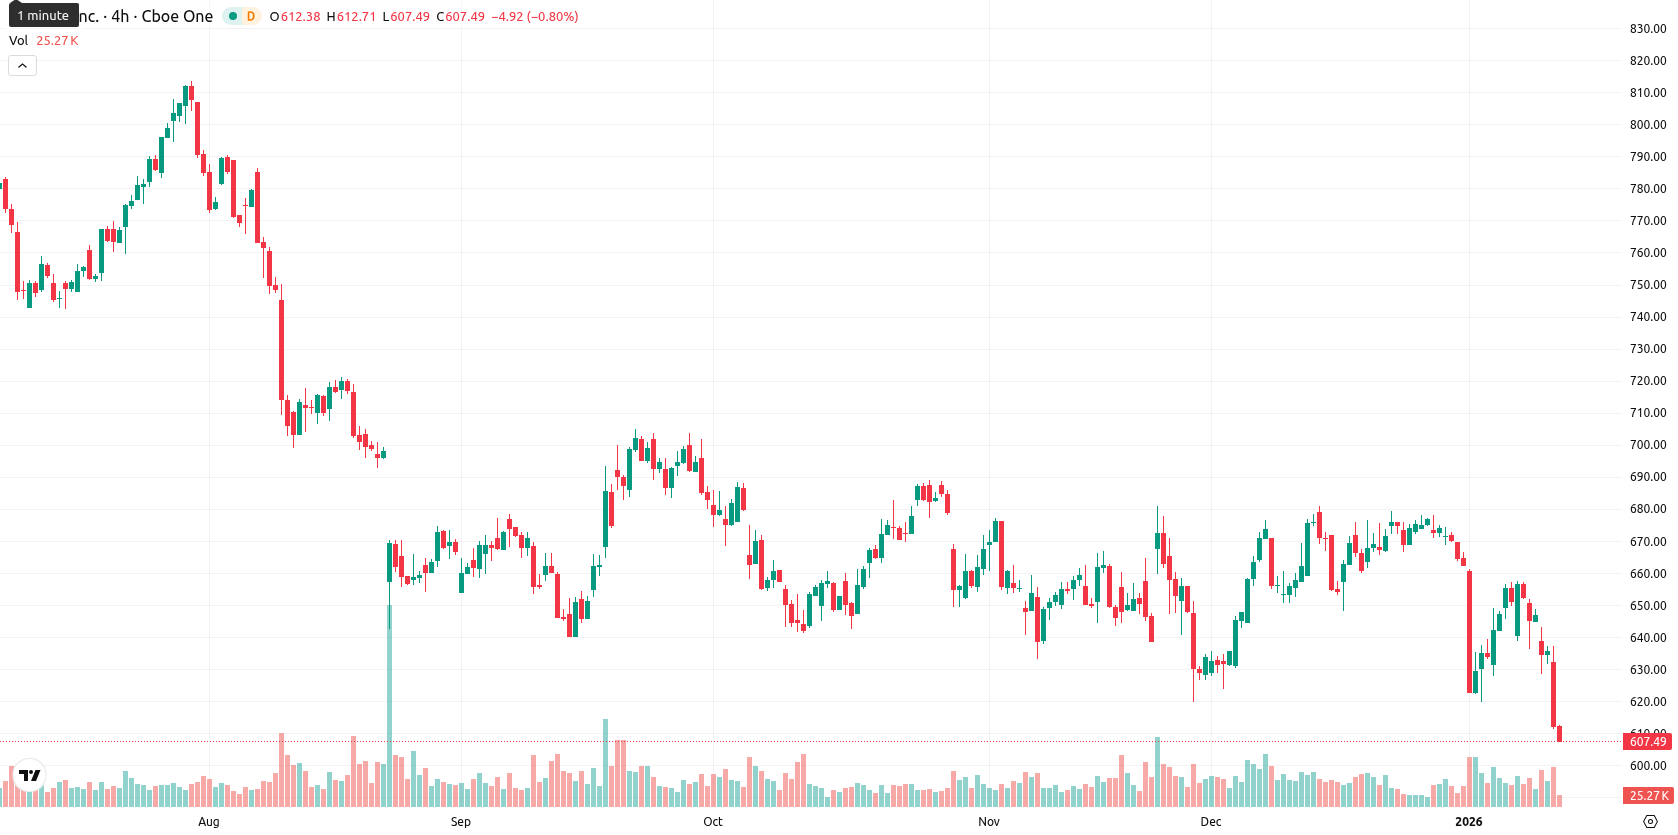
-4.81% for Intuit stock — RSI and MACD signal persistent downside pressure

Intuit Inc. (INTU) is trading at $604.86 after a sharp decline of $30.58, or 4.81%, on the day. The price remains well below the MA-20 ($659.99), MA-50 ($656.22), and MA-200 ($683.55), underscoring broad-based selling pressure across all major timeframes.
Highlights
- Intuit reported quarterly earnings of $3.34 per share on revenue of $3.87 billion, beating consensus estimates with a net margin of 21.19%.
- The company announced a quarterly dividend of $1.20 per share, payable January 16 with an ex-dividend date of January 9, and set guidance for Q2 2026 earnings.
- Institutional investors such as S Bank Fund Management Ltd, PKO Investment Management Joint Stock Co, and Tema Etfs LLC increased their holdings, supported by Fundsmith Equity Fund's recognition of consistent growth.
Investor accumulation rises as earnings and guidance surpass forecasts
Intuit reported quarterly earnings of $3.34 per share on revenue of $3.87 billion, beating consensus estimates and highlighting strong financial performance with a return on equity of 23.52% and a net margin of 21.19%. The company also set its Q2 2026 earnings guidance and announced a quarterly dividend of $1.20 per share, with payment scheduled for January 16 and an ex-dividend date on January 9. Multiple institutional investors, including S Bank Fund Management Ltd, PKO Investment Management Joint Stock Co, and Tema Etfs LLC, have increased their holdings in Intuit, while Fundsmith Equity Fund recognized its consistent growth and profitability.
Bearish momentum persists as indicators align with overhead resistance
The technical picture remains weak, with Intuit trading beneath all major moving averages and facing immediate dynamic resistance at the Ichimoku Kijun level of $650.28. Momentum signals on the daily chart are decisively bearish: MACD is deep in negative territory, ADX shows no clear dominant trend, and oversold conditions are evident with RSI at 40.22, Stochastic RSI at 22.70, and a sharply negative CCI. Bull/Bear Power confirms seller dominance intraday at -9.16, and price action has been confined to the low end of the session’s range amid heightened volatility.
Limited rebound prospects as volatility favors continued downside risk
For the next five trading days, the typical volatility band is expected between $590.00 and $625.00, reflecting the ongoing sell-side pressure and recent price swings. Sideways consolidation near recent lows is the baseline outlook, with a bullish reversal possible only if the price breaks above resistance at $650.28. If bearish momentum continues and Intuit slips below $590.00, a deeper pullback could develop.


-
 Afghanistan
-
 Albania
-
 Algeria
-
 Angola
-
 Argentina
-
 Armenia
-
 Australia
-
 Austria
-
 Azerbaijan
-
 Bahamas
-
 Bahrain
-
 Bangladesh
-
 Belarus
-
 Belgium
-
 Bolivia
-
 Botswana
-
 Brazil
-
 Brunei
-
 Bulgaria
-
 Cambodia
-
 Cameroon
-
 Canada
-
 Chile
Chile
-
 China
China
-
 Colombia
-
 Congo
Congo
-
 Costa Rica
-
 Cote d'Ivoire
-
 Croatia
-
 Cuba
Cuba
-
 Cyprus
-
 Czechia
-
 DR Congo
-
 Denmark
-
 Dominican Republic
-
 Ecuador
-
 Egypt
Egypt
-
 El Salvador
-
 Estonia
-
 Eswatini
-
 Ethiopia
-
 Finland
-
 France
-
 Georgia
-
 Germany
-
 Ghana
Ghana
-
 Greece
-
 Haiti
Haiti
-
 Hong Kong
-
 Hungary
-
 India
India
-
 Indonesia
-
 Iran, Islamic republic
-
 Iraq
Iraq
-
 Ireland
-
 Israel
-
 Italy
Italy
-
 Jamaica
-
 Japan
Japan
-
 Jordan
-
 Kazakhstan
-
 Kenya
Kenya
-
 Korea
Korea
-
 Kuwait
-
 Kyrgyzstan
-
 Laos
Laos
-
 Latvia
-
 Lebanon
-
 Lesotho
-
 Libya
Libya
-
 Lithuania
-
 Luxembourg
-
 Madagascar
-
 Malaysia
-
 Malta
Malta
-
 Mauritius
-
 Mexico
-
 Moldova
-
 Mongolia
-
 Montenegro
-
 Morocco
-
 Mozambique
-
 Myanmar
-
 Namibia
-
 Nepal
Nepal
-
 Netherlands
-
 New Zealand
-
 Nigeria
-
 North Macedonia
-
 Norway
-
 Oman
Oman
-
 Pakistan
-
 Palestine
-
 Panama
-
 Papua New Guinea
-
 Paraguay
-
 Peru
Peru
-
 Philippines
-
 Poland
-
 Portugal
-
 Puerto Rico
-
 Qatar
Qatar
-
 Reunion
-
 Romania
-
 Rwanda
-
 Saudi Arabia
-
 Serbia
-
 Singapore
-
 Slovakia
-
 Slovenia
-
 Somalia
-
 South Africa
-
 Spain
Spain
-
 Sri Lanka
-
 Sweden
-
 Switzerland
-
 Syria
Syria
-
 Taiwan
-
 Tajikistan
-
 Tanzania
-
 Thailand
-
 Trinidad and Tobago
-
 Tunisia
-
 Turkey
-
 UAE
UAE
-
 Uganda
-
 Ukraine
-
 United Kingdom
-
United States
-
 Uruguay
-
 Uzbekistan
-
 Venezuela
-
 Vietnam
-
 Yemen
Yemen
-
 Zambia
-
 Zimbabwe
- Forex
- Crypto
