
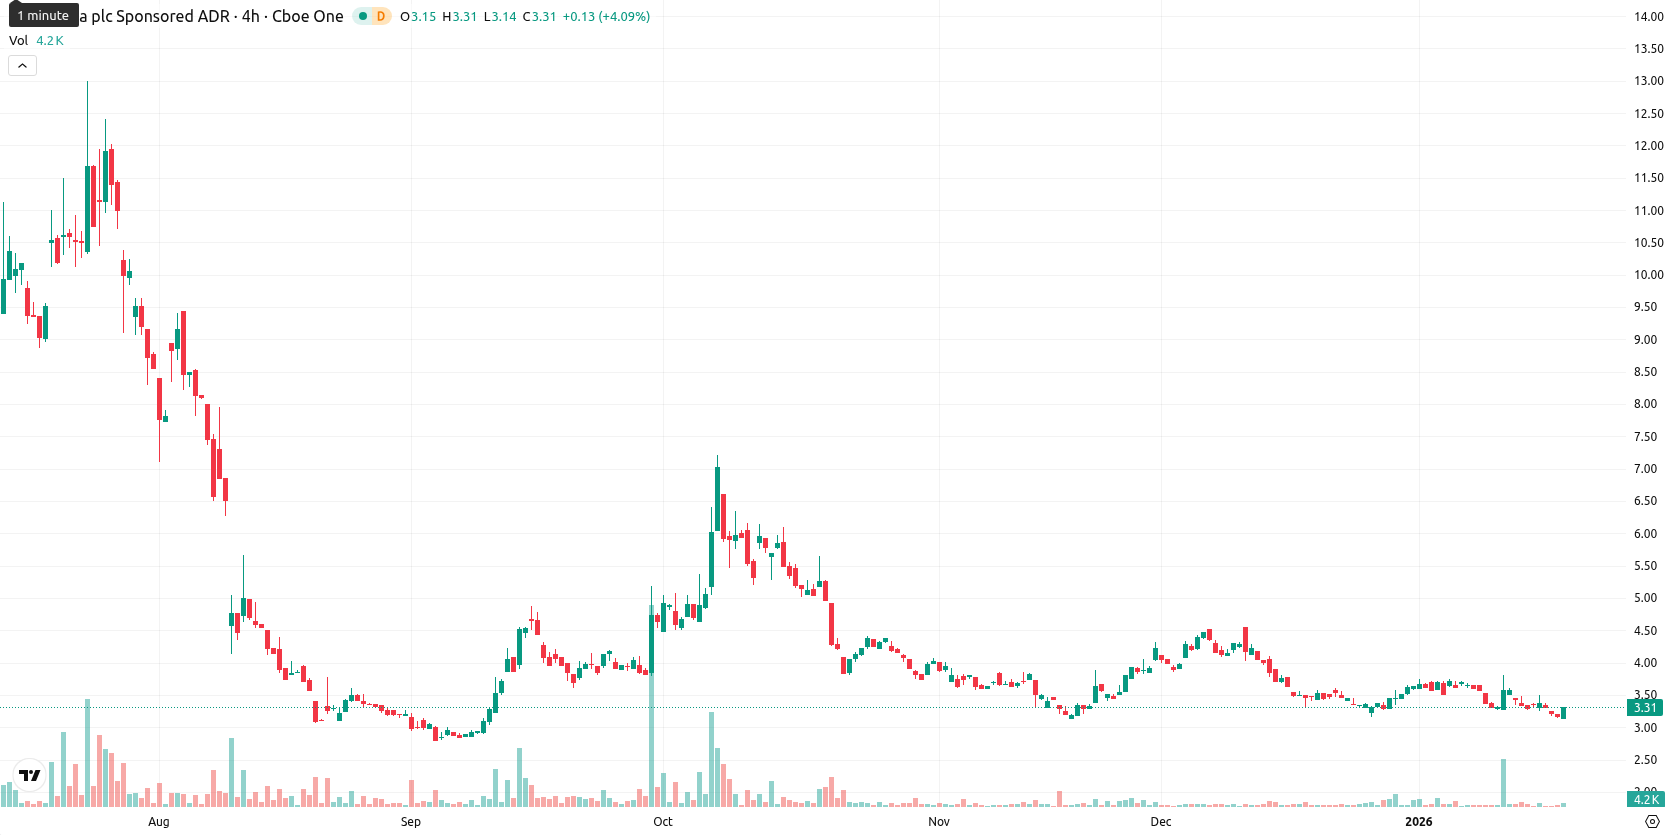
NuCana stock rises 3.66% as technicals signal oversold conditions persist

NuCana plc ADR (NCNA) is trading at $3.33, which places it below the MA-20 ($3.46), MA-50 ($3.66), and well beneath the MA-200 ($23.09), indicating persistent seller pressure across short-, medium-, and long-term horizons. The nearest dynamic resistance is at the Ichimoku Kijun level of $3.70, while immediate support is closer to today’s intraday lows.
Highlights
- NCNA trades at $3.33, below MA-20 ($3.46), MA-50 ($3.66), and far under MA-200 ($23.09), signaling persistent downward pressure across all timeframes.
- Momentum indicators remain weak with MACD in sell territory, ADX showing no clear trend, and both RSI (38.01) and CCI (-135.80) in oversold territory.
- Five-day outlook projects NCNA ranging between $3.00–$3.60, with a probability of further price increase below 20% and bearish bias prevailing.
Oversold signals diverge from continued weak momentum
Momentum signals remain weak, with the MACD in sell territory and the ADX pointing to a lack of strong trend. Both the RSI (38.01) and CCI (-135.80) indicate oversold conditions, and the Stochastic RSI is also signaling an oversold state, suggesting possible short-term exhaustion among sellers. Bull/Bear Power is negative with a “Sell” direction, confirming that sellers still dominate intraday. Despite a modest daily gain of 3.66% (up $0.12), there was no gap between sessions, and the price has reached the upper end of today’s range, reflecting moderate volatility and a tendency toward strength after the open. There is a clear divergence between deeply oversold oscillators and ongoing weak momentum, so the bounce lacks decisive confirmation from trend signals.
Limited upside as bearish outlook dominates short-term scenario
Looking ahead, the expected range for the next five trading days is $3.00 – $3.60, keeping movement within a typical volatility band relative to current levels. The probability of a further price increase is very low (less than 20%), making a decline the more likely scenario in the short term. The baseline scenario is for NCNA to move sideways near current levels as oversold conditions persist. A bullish scenario would require a break above $3.70 with stronger trend momentum, while a bearish outcome unfolds if support near $3.14 – $3.00 is lost, potentially leading to further declines.
Last time, analysts noted that NuCana plc ADR (NCNA) showed mild short-term bullishness as it traded slightly above its 20-day moving average but remained constrained below key medium- and long-term averages, reflecting persistent broader weakness. Mixed momentum signals—including a negative MACD, neutral-to-weak RSI, and strong short-term Stoch RSI—highlight immediate resistance at $3.70–$3.86 and underscore ongoing speculative buying amid elevated volatility.


Latest NuCana News


-
 Afghanistan
-
 Albania
-
 Algeria
-
 Angola
-
 Argentina
-
 Armenia
-
 Australia
-
 Austria
-
 Azerbaijan
-
 Bahamas
-
 Bahrain
-
 Bangladesh
-
 Belarus
-
 Belgium
-
 Bolivia
-
 Botswana
-
 Brazil
-
 Brunei
-
 Bulgaria
-
 Cambodia
-
 Cameroon
-
 Canada
-
 Chile
Chile
-
 China
China
-
 Colombia
-
 Congo
Congo
-
 Costa Rica
-
 Cote d'Ivoire
-
 Croatia
-
 Cuba
Cuba
-
 Cyprus
-
 Czechia
-
 DR Congo
-
 Denmark
-
 Dominican Republic
-
 Ecuador
-
 Egypt
Egypt
-
 El Salvador
-
 Estonia
-
 Eswatini
-
 Ethiopia
-
 Finland
-
 France
-
 Georgia
-
 Germany
-
 Ghana
Ghana
-
 Greece
-
 Haiti
Haiti
-
 Hong Kong
-
 Hungary
-
 India
India
-
 Indonesia
-
 Iran, Islamic republic
-
 Iraq
Iraq
-
 Ireland
-
 Israel
-
 Italy
Italy
-
 Jamaica
-
 Japan
Japan
-
 Jordan
-
 Kazakhstan
-
 Kenya
Kenya
-
 Korea
Korea
-
 Kuwait
-
 Kyrgyzstan
-
 Laos
Laos
-
 Latvia
-
 Lebanon
-
 Lesotho
-
 Libya
Libya
-
 Lithuania
-
 Luxembourg
-
 Madagascar
-
 Malaysia
-
 Malta
Malta
-
 Mauritius
-
 Mexico
-
 Moldova
-
 Mongolia
-
 Montenegro
-
 Morocco
-
 Mozambique
-
 Myanmar
-
 Namibia
-
 Nepal
Nepal
-
 Netherlands
-
 New Zealand
-
 Nigeria
-
 North Macedonia
-
 Norway
-
 Oman
Oman
-
 Pakistan
-
 Palestine
-
 Panama
-
 Papua New Guinea
-
 Paraguay
-
 Peru
Peru
-
 Philippines
-
 Poland
-
 Portugal
-
 Puerto Rico
-
 Qatar
Qatar
-
 Reunion
-
 Romania
-
 Rwanda
-
 Saudi Arabia
-
 Serbia
-
 Singapore
-
 Slovakia
-
 Slovenia
-
 Somalia
-
 South Africa
-
 Spain
Spain
-
 Sri Lanka
-
 Sweden
-
 Switzerland
-
 Syria
Syria
-
 Taiwan
-
 Tajikistan
-
 Tanzania
-
 Thailand
-
 Trinidad and Tobago
-
 Tunisia
-
 Turkey
-
 UAE
UAE
-
 Uganda
-
 Ukraine
-
 United Kingdom
-
United States
-
 Uruguay
-
 Uzbekistan
-
 Venezuela
-
 Vietnam
-
 Yemen
Yemen
-
 Zambia
-
 Zimbabwe
- Forex
- Crypto
