
INTU weekly outlook: consolidates near $549.02 as bearish momentum persists below key moving averages

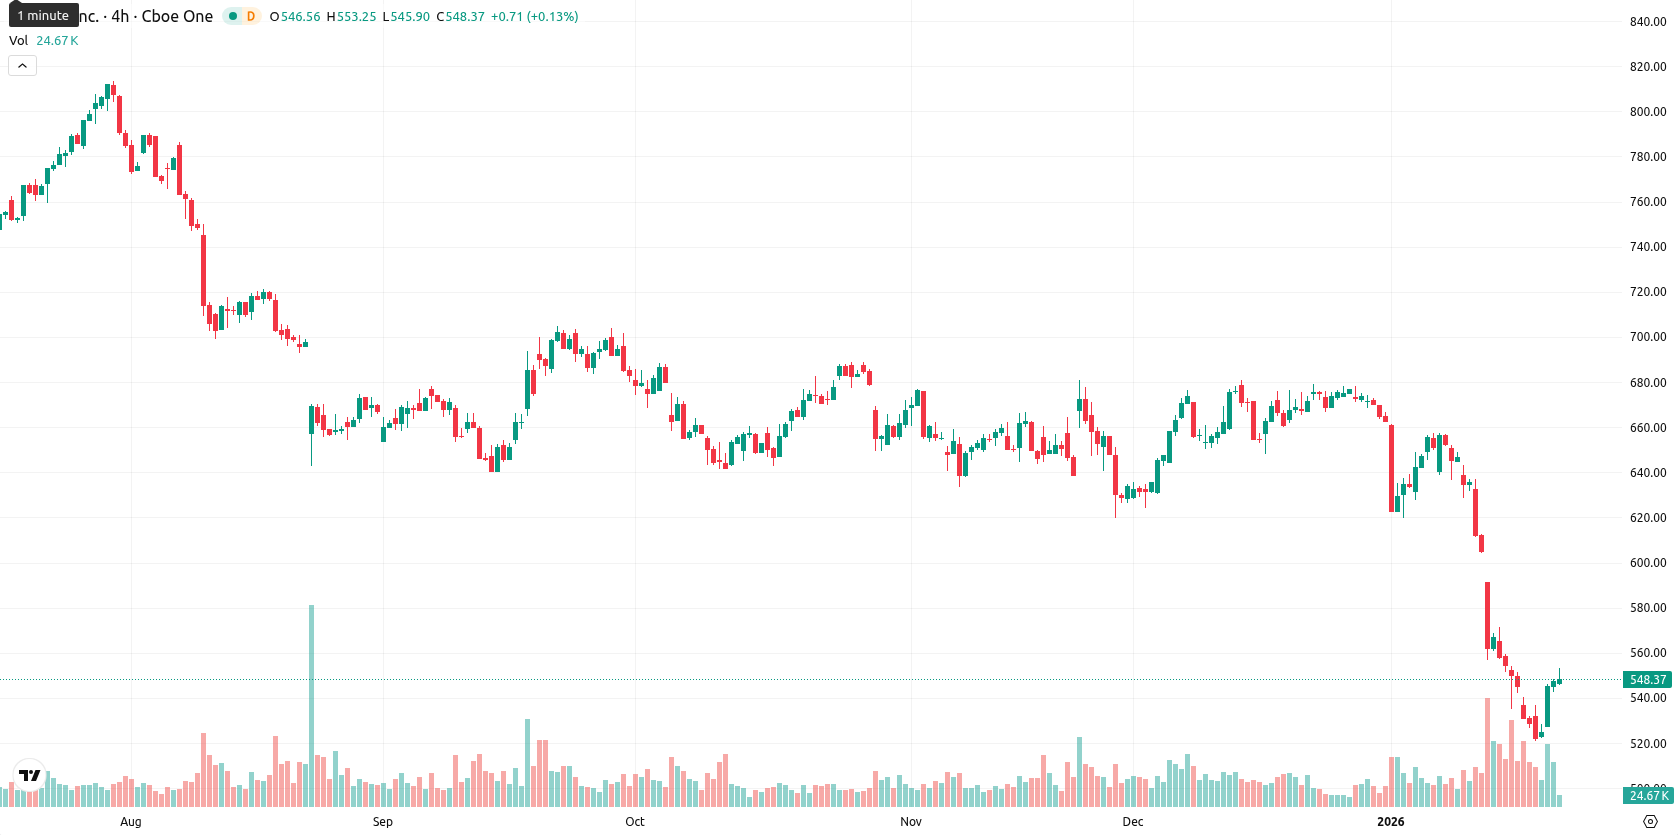
Intuit Inc. (INTU) is currently trading at $549.02, marking a weekly gain of 0.83% from $544.80. The asset remains well below its weekly MA-20 ($651.83), MA-50 ($667.50), and MA-200 ($557.18), highlighting sustained bearish momentum and its position beneath key moving averages across all primary time frames.
Highlights
- INTU is trading at $549.02, below the MA-20 ($651.83), MA-50 ($667.50), and MA-200 ($557.18), reflecting strong bearish pressure across all timeframes.
- Weekly technicals show negative momentum (MACD Sell signal, ADX 15.31), with oscillators like RSI (33.02) and CCI deeply negative, indicating oversold conditions amid high volatility.
- Rangebound movement is likely between $540.00 support and $560.00 resistance, with a bearish bias and very low probability (<20%) of a sustained upside move.
Revenue surge and AI rollout spur product-driven market activity this week
Intuit completed the nationwide rollout of its AI-powered TurboTax flagship store and nearly 600 Expert Office locations, advancing its integration of physical and digital tax services. The company also secured a new $2.2 billion revolving credit facility to support its tax products and ongoing AI-driven initiatives. Additionally, Intuit reported an 18% rise in first-quarter revenue and a 34% increase in EPS, maintained its quarterly dividend of $1.20 per share paid on January 16th, and saw heightened market activity around product expansion and investment actions.
Oversold signals persist as negative momentum dominates weekly chart
On the weekly chart, INTU remains below the MA-20, MA-50, and MA-200, signaling strong bearish pressure over short, medium, and long-term horizons. W1 support is at $540.00, with resistance at $560.00; the dynamic Kijun resistance stands at $667.20. Weekly oscillators are mixed: RSI at 33.02 and deeply negative CCI flag oversold conditions, while Stoch RSI and BBP confirm that sellers dominated throughout most of the week. ADX at 15.31 suggests weak trend strength, and MACD remains negative with a clear Sell signal, supported by the negative Awesome Oscillator.
Sideways movement likely as bearish momentum persists next week
For the coming week, the baseline scenario is for INTU to trade in a sideways corridor between $540.00 support and $560.00 resistance, as indicated by lingering negative momentum and the absence of a strong reversal signal. Volatility is expected to remain elevated in the $540.00 to $560.00 range. A bullish breakout would require a sustained move above $560.00 to open further upside potential, while a close below $540.00 may trigger another test of last week's lows. The probability of a meaningful rebound remains low, with short-term oscillators only hinting at possible stabilization.
Previously it was reported that Intuit Inc. is trading well below its key moving averages, with momentum indicators such as RSI and MACD highlighting persistent bearish pressure and heavily oversold conditions. Despite a modest intraday rise, the trend remains negative, with limited support nearby and a low probability of sustained upside in the near term.


-
 Afghanistan
-
 Albania
-
 Algeria
-
 Angola
-
 Argentina
-
 Armenia
-
 Australia
-
 Austria
-
 Azerbaijan
-
 Bahamas
-
 Bahrain
-
 Bangladesh
-
 Belarus
-
 Belgium
-
 Bolivia
-
 Botswana
-
 Brazil
-
 Brunei
-
 Bulgaria
-
 Cambodia
-
 Cameroon
-
 Canada
-
 Chile
Chile
-
 China
China
-
 Colombia
-
 Congo
Congo
-
 Costa Rica
-
 Cote d'Ivoire
-
 Croatia
-
 Cuba
Cuba
-
 Cyprus
-
 Czechia
-
 DR Congo
-
 Denmark
-
 Dominican Republic
-
 Ecuador
-
 Egypt
Egypt
-
 El Salvador
-
 Estonia
-
 Eswatini
-
 Ethiopia
-
 Finland
-
 France
-
 Georgia
-
 Germany
-
 Ghana
Ghana
-
 Greece
-
 Haiti
Haiti
-
 Hong Kong
-
 Hungary
-
 India
India
-
 Indonesia
-
 Iran, Islamic republic
-
 Iraq
Iraq
-
 Ireland
-
 Israel
-
 Italy
Italy
-
 Jamaica
-
 Japan
Japan
-
 Jordan
-
 Kazakhstan
-
 Kenya
Kenya
-
 Korea
Korea
-
 Kuwait
-
 Kyrgyzstan
-
 Laos
Laos
-
 Latvia
-
 Lebanon
-
 Lesotho
-
 Libya
Libya
-
 Lithuania
-
 Luxembourg
-
 Madagascar
-
 Malaysia
-
 Malta
Malta
-
 Mauritius
-
 Mexico
-
 Moldova
-
 Mongolia
-
 Montenegro
-
 Morocco
-
 Mozambique
-
 Myanmar
-
 Namibia
-
 Nepal
Nepal
-
 Netherlands
-
 New Zealand
-
 Nigeria
-
 North Macedonia
-
 Norway
-
 Oman
Oman
-
 Pakistan
-
 Palestine
-
 Panama
-
 Papua New Guinea
-
 Paraguay
-
 Peru
Peru
-
 Philippines
-
 Poland
-
 Portugal
-
 Puerto Rico
-
 Qatar
Qatar
-
 Reunion
-
 Romania
-
 Rwanda
-
 Saudi Arabia
-
 Serbia
-
 Singapore
-
 Slovakia
-
 Slovenia
-
 Somalia
-
 South Africa
-
 Spain
Spain
-
 Sri Lanka
-
 Sweden
-
 Switzerland
-
 Syria
Syria
-
 Taiwan
-
 Tajikistan
-
 Tanzania
-
 Thailand
-
 Trinidad and Tobago
-
 Tunisia
-
 Turkey
-
 UAE
UAE
-
 Uganda
-
 Ukraine
-
 United Kingdom
-
United States
-
 Uruguay
-
 Uzbekistan
-
 Venezuela
-
 Vietnam
-
 Yemen
Yemen
-
 Zambia
-
 Zimbabwe
- Forex
- Crypto
