
Microsoft stock price forecast: Volatility persists as MSFT trades near resistance after upbeat Q2 results

Microsoft Corporation (MSFT) is trading at $481.72, above its MA-20 at $470.48 and MA-50 at $479.20, but still below the MA-200 at $485.50. This arrangement reflects short- and medium-term upward momentum, although the longer-term trend is approaching resistance near $485.
Highlights
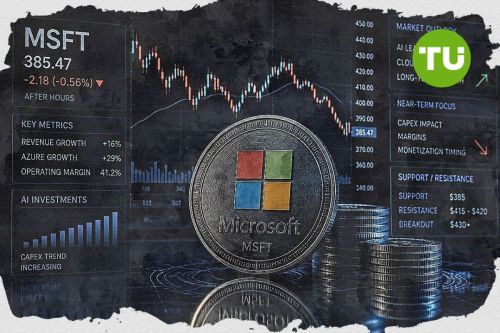
- Microsoft's fiscal Q2 2026 revenue of $81.3 billion and adjusted EPS of $5.16 both exceeded Wall Street expectations, driven by AI and cloud demand.
- Cloud revenue surpassed $50 billion for the first time, but record capital expenditures of $37.5 billion and ongoing AI capacity constraints weighed on investor sentiment.
- MSFT trades at $481.72, with key resistance at $485 and dynamic support near $464–$470; technicals imply sideways action with low probability of a short-term rally.
Sentiment cautious as cloud growth slows despite earnings beat
Microsoft reported its fiscal Q2 2026 earnings, posting $81.3 billion in revenue and adjusted earnings per share of $5.16, both exceeding Wall Street expectations. However, slower cloud computing growth and record capital expenditures of $37.5 billion influenced investor sentiment, with ongoing AI capacity constraints highlighted as a potential limiting factor. The cloud business achieved over $50 billion in revenue for the first time, buoyed by AI expansion and Microsoft 365 Copilot AI adoption.

Overbought conditions emerge as momentum signals diverge
Technical indicators show mixed momentum: the MACD is giving a Strong Sell signal, while the ADX remains Neutral and low, reflecting a lack of trend strength. Oscillators such as the Stochastic RSI, CCI, and Bull/Bear Power all signal overbought conditions, with buyers dominant, but the RSI is moderate at 56.83. The price action for the day shows a modest gain of $1.14 (0.24%) and a small upside gap, with session volatility and the trading tone remaining moderate and slightly positive. Divergence between strongly overbought oscillators and a negative daily MACD suggests caution, as near-term bullishness may not be strongly supported by momentum.
Probability of short-term decline rises amid limited bullish signals
In the short term, the expected price range for the next five trading days is $468.80 to $483.54, reflecting a typical volatility band relative to current levels. With only one Buy signal among four major weekly indicators, the probability of a price increase is low — less than 20% — making a short-term decline more likely. The main scenario anticipates sideways movement between dynamic support at $464–$470 and resistance at $483–$485. A break above $485 could extend a rally, while a drop below $470 may open the path to support around $465.
Previously it was reported that the S&P 500 surpassed the 7,000-point milestone, buoyed by continued strength in major technology and AI-related stocks, with the “Magnificent Seven” contributing the majority of recent gains. Momentum indicators suggest the index remains in a strong uptrend, trading above key moving averages, though short-term resistance may emerge if earnings disappoint or if overbought levels, as signaled by RSI, become more pronounced.


Latest Microsoft News


-
 Afghanistan
-
 Albania
-
 Algeria
-
 Angola
-
 Argentina
-
 Armenia
-
 Australia
-
 Austria
-
 Azerbaijan
-
 Bahamas
-
 Bahrain
-
 Bangladesh
-
 Belarus
-
 Belgium
-
 Bolivia
-
 Botswana
-
 Brazil
-
 Brunei
-
 Bulgaria
-
 Cambodia
-
 Cameroon
-
 Canada
-
 Chile
Chile
-
 China
China
-
 Colombia
-
 Congo
Congo
-
 Costa Rica
-
 Cote d'Ivoire
-
 Croatia
-
 Cuba
Cuba
-
 Cyprus
-
 Czechia
-
 DR Congo
-
 Denmark
-
 Dominican Republic
-
 Ecuador
-
 Egypt
Egypt
-
 El Salvador
-
 Estonia
-
 Eswatini
-
 Ethiopia
-
 Finland
-
 France
-
 Georgia
-
 Germany
-
 Ghana
Ghana
-
 Greece
-
 Haiti
Haiti
-
 Hong Kong
-
 Hungary
-
 India
India
-
 Indonesia
-
 Iran, Islamic republic
-
 Iraq
Iraq
-
 Ireland
-
 Israel
-
 Italy
Italy
-
 Jamaica
-
 Japan
Japan
-
 Jordan
-
 Kazakhstan
-
 Kenya
Kenya
-
 Korea
Korea
-
 Kuwait
-
 Kyrgyzstan
-
 Laos
Laos
-
 Latvia
-
 Lebanon
-
 Lesotho
-
 Libya
Libya
-
 Lithuania
-
 Luxembourg
-
 Madagascar
-
 Malaysia
-
 Malta
Malta
-
 Mauritius
-
 Mexico
-
 Moldova
-
 Mongolia
-
 Montenegro
-
 Morocco
-
 Mozambique
-
 Myanmar
-
 Namibia
-
 Nepal
Nepal
-
 Netherlands
-
 New Zealand
-
 Nigeria
-
 North Macedonia
-
 Norway
-
 Oman
Oman
-
 Pakistan
-
 Palestine
-
 Panama
-
 Papua New Guinea
-
 Paraguay
-
 Peru
Peru
-
 Philippines
-
 Poland
-
 Portugal
-
 Puerto Rico
-
 Qatar
Qatar
-
 Reunion
-
 Romania
-
 Rwanda
-
 Saudi Arabia
-
 Serbia
-
 Singapore
-
 Slovakia
-
 Slovenia
-
 Somalia
-
 South Africa
-
 Spain
Spain
-
 Sri Lanka
-
 Sweden
-
 Switzerland
-
 Syria
Syria
-
 Taiwan
-
 Tajikistan
-
 Tanzania
-
 Thailand
-
 Trinidad and Tobago
-
 Tunisia
-
 Turkey
-
 UAE
UAE
-
 Uganda
-
 Ukraine
-
 United Kingdom
-
United States
-
 Uruguay
-
 Uzbekistan
-
 Venezuela
-
 Vietnam
-
 Yemen
Yemen
-
 Zambia
-
 Zimbabwe
- Forex
- Crypto
