
Palantir stock price forecast: Downtrend persists as PLTR tests $146 support

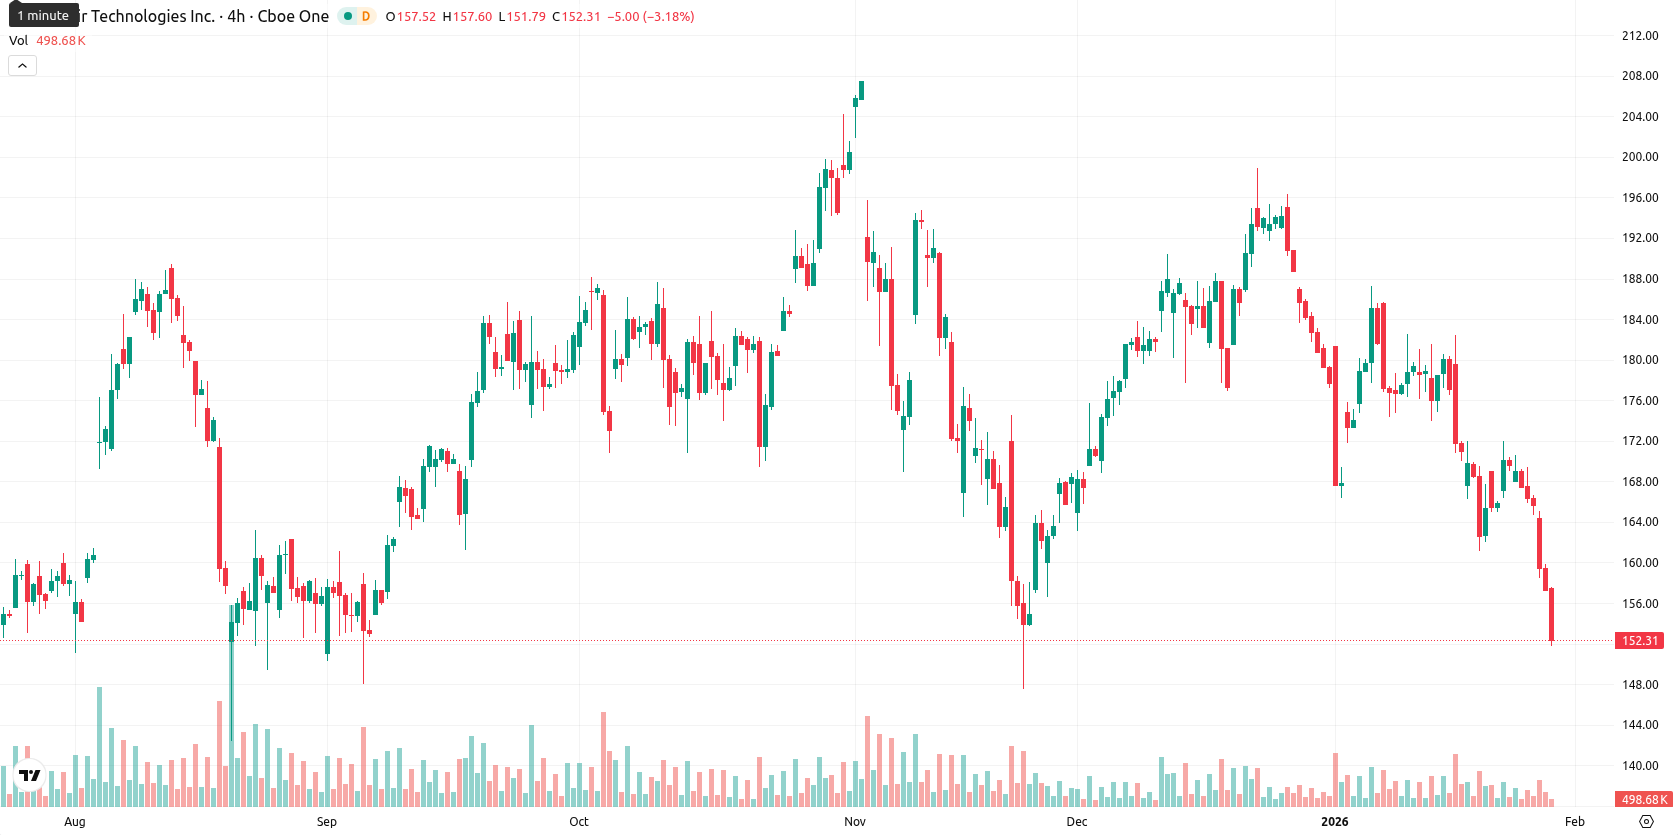
Palantir Technologies Inc (PLTR) is trading at $152.55, below its MA-20 at $173.05, MA-50 at $175.77, and MA-200 at $158.33, signaling sustained downside pressure across short-, medium-, and long-term trends. The nearest dynamic resistance is the Ichimoku Kijun at $178.10, with the MA-200 ($158.33) now acting as the closest long-term support.
Highlights
- Palantir reports strong adoption of its Artificial Intelligence Platform (AIP) across commercial and government sectors, with a major 10-year, $10 billion U.S. Army contract secured.
- The company maintains a robust balance sheet with approximately $6.4 billion in cash and no debt ahead of its Q4 2025 earnings announcement on February 2, 2026.
- PLTR trades at $152.55, below key moving averages and deep in oversold territory, with bearish momentum and expected consolidation between $146.00 and $158.00 for the coming week.
Contract wins bolster financial strength ahead of earnings catalyst
Palantir continues to see strong adoption of its Artificial Intelligence Platform (AIP) by both commercial and government clients. The company is set to announce its fourth-quarter 2025 earnings on February 2, 2026, with expectations of ongoing revenue and EPS growth. Palantir maintains a robust financial position with approximately $6.4 billion in cash and no debt, and has recently secured major government contracts such as a 10-year, $10 billion agreement with the U.S. Army.
Bearish momentum intensifies as oscillators and volume confirm pressure
Momentum is firmly negative, with the MACD and ADX both aligning to the downside and indicating a lack of bullish strength. The RSI at 31.69, Stochastic RSI at 0.00, and CCI at –173.56 all reflect deep oversold conditions, while Bull/Bear Power at –4.74 confirms seller dominance through the session. The Awesome Oscillator also supports the downtrend, adding another bearish signal. There was a small downside gap at the open, with the price moving down 3.11% to trade near today’s low in a narrow daily range, signaling low intraday volatility and persistent pressure after the open. Oscillator and momentum signals are unanimously bearish and reinforce the ongoing downside move.
Rangebound action likely as downside risk dominates short-term outlook
For the coming week, the expected trading range is normalized to $146.00 – $158.00, keeping price action within 4% above and below current levels in line with historical volatility. The probability of a price increase is very low (less than 20%), making further downside much more likely. The baseline scenario is sideways movement between $146.00 and $158.00 as the market consolidates following a sharp selloff. A bullish scenario would require a bounce above resistance at $158.00 and a move toward the Ichimoku Kijun, while a bearish scenario unfolds if the price breaks below $146.00, confirming a continued decline.
Last time, analysts noted that Palantir Technologies is trading below its short- and medium-term moving averages but remains above long-term support at the MA-200, indicating ongoing short-term selling pressure amid a still-supported broader trend. Momentum and oscillators such as the MACD, RSI, and CCI confirm a prevailing bearish bias with oversold conditions, while resistance is noted near $166–$180 and support in the $150–$157 range, suggesting a likely sideways range unless major levels are breached.


-
 Afghanistan
-
 Albania
-
 Algeria
-
 Angola
-
 Argentina
-
 Armenia
-
 Australia
-
 Austria
-
 Azerbaijan
-
 Bahamas
-
 Bahrain
-
 Bangladesh
-
 Belarus
-
 Belgium
-
 Bolivia
-
 Botswana
-
 Brazil
-
 Brunei
-
 Bulgaria
-
 Cambodia
-
 Cameroon
-
 Canada
-
 Chile
Chile
-
 China
China
-
 Colombia
-
 Congo
Congo
-
 Costa Rica
-
 Cote d'Ivoire
-
 Croatia
-
 Cuba
Cuba
-
 Cyprus
-
 Czechia
-
 DR Congo
-
 Denmark
-
 Dominican Republic
-
 Ecuador
-
 Egypt
Egypt
-
 El Salvador
-
 Estonia
-
 Eswatini
-
 Ethiopia
-
 Finland
-
 France
-
 Georgia
-
 Germany
-
 Ghana
Ghana
-
 Greece
-
 Haiti
Haiti
-
 Hong Kong
-
 Hungary
-
 India
India
-
 Indonesia
-
 Iran, Islamic republic
-
 Iraq
Iraq
-
 Ireland
-
 Israel
-
 Italy
Italy
-
 Jamaica
-
 Japan
Japan
-
 Jordan
-
 Kazakhstan
-
 Kenya
Kenya
-
 Korea
Korea
-
 Kuwait
-
 Kyrgyzstan
-
 Laos
Laos
-
 Latvia
-
 Lebanon
-
 Lesotho
-
 Libya
Libya
-
 Lithuania
-
 Luxembourg
-
 Madagascar
-
 Malaysia
-
 Malta
Malta
-
 Mauritius
-
 Mexico
-
 Moldova
-
 Mongolia
-
 Montenegro
-
 Morocco
-
 Mozambique
-
 Myanmar
-
 Namibia
-
 Nepal
Nepal
-
 Netherlands
-
 New Zealand
-
 Nigeria
-
 North Macedonia
-
 Norway
-
 Oman
Oman
-
 Pakistan
-
 Palestine
-
 Panama
-
 Papua New Guinea
-
 Paraguay
-
 Peru
Peru
-
 Philippines
-
 Poland
-
 Portugal
-
 Puerto Rico
-
 Qatar
Qatar
-
 Reunion
-
 Romania
-
 Rwanda
-
 Saudi Arabia
-
 Serbia
-
 Singapore
-
 Slovakia
-
 Slovenia
-
 Somalia
-
 South Africa
-
 Spain
Spain
-
 Sri Lanka
-
 Sweden
-
 Switzerland
-
 Syria
Syria
-
 Taiwan
-
 Tajikistan
-
 Tanzania
-
 Thailand
-
 Trinidad and Tobago
-
 Tunisia
-
 Turkey
-
 UAE
UAE
-
 Uganda
-
 Ukraine
-
 United Kingdom
-
United States
-
 Uruguay
-
 Uzbekistan
-
 Venezuela
-
 Vietnam
-
 Yemen
Yemen
-
 Zambia
-
 Zimbabwe
- Forex
- Crypto
