
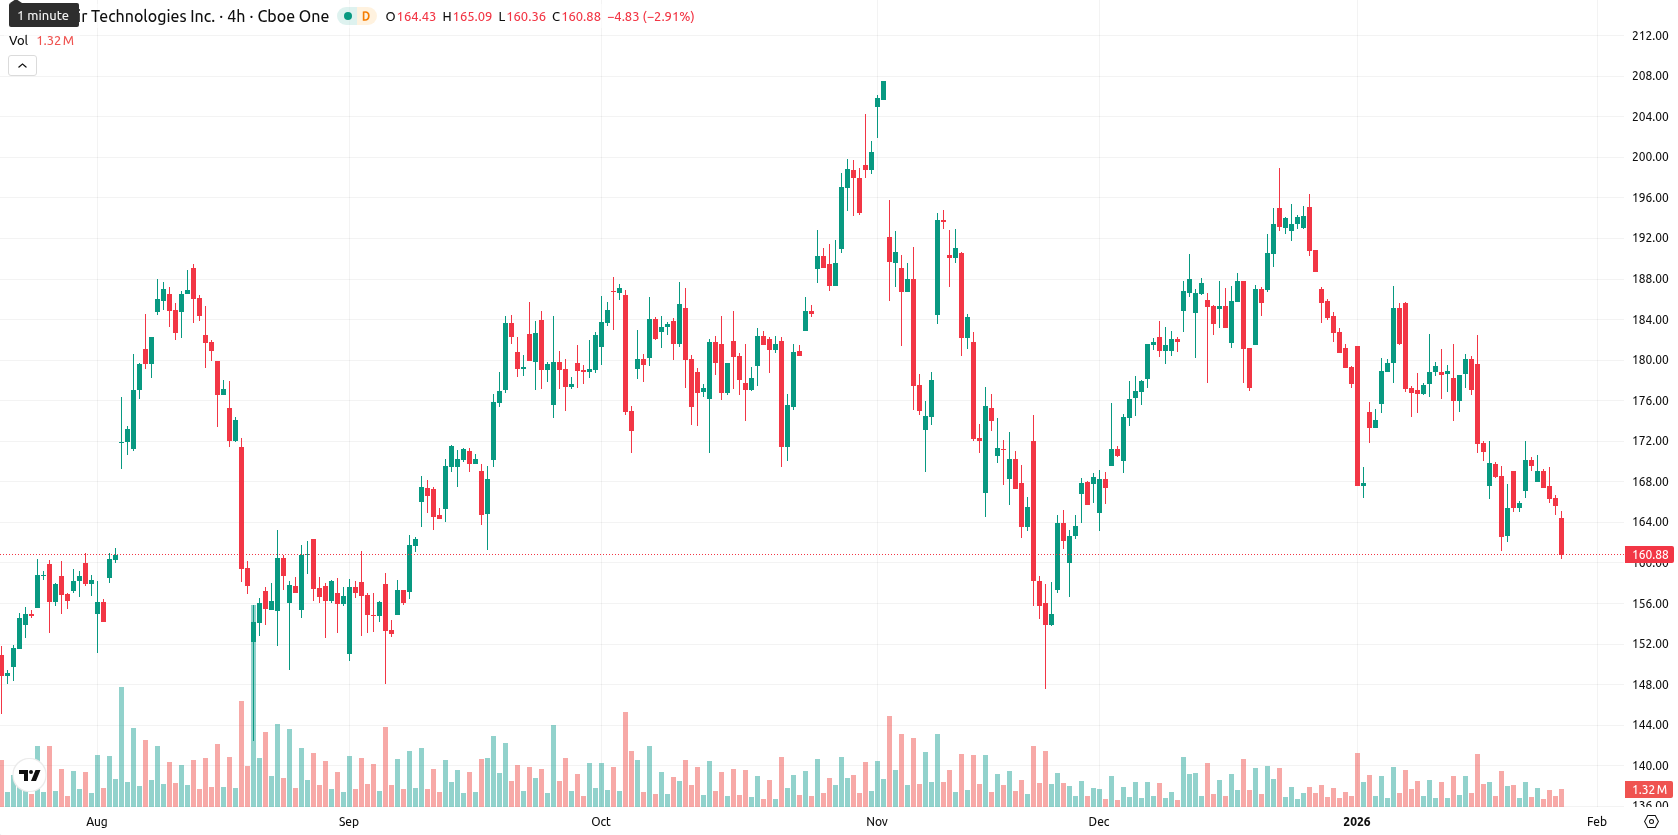
Palantir stock: Volatility and negative momentum create risk of further declines

Palantir Technologies Inc (PLTR) is trading at $160.36, which is below both the MA-20 at $174.39 and the MA-50 at $176.06, but just above the MA-200 at $157.99. This setup points to ongoing short-term and medium-term selling pressure, while the longer-term trend still finds some support above the MA-200; the nearest dynamic resistance is around the Ichimoku Kijun level at $180.00.
Highlights
- PLTR closed at $160.36, trading below its MA-20 ($174.39) and MA-50 ($176.06), but maintaining support just above the MA-200 ($157.99).
- Momentum indicators including MACD, ADX, and Awesome Oscillator signal persistent selling pressure, with intraday volatility driven by a 3.23% price drop today.
- A realistic short-term price corridor for the next 5 trading days is $150.00 to $166.00, with a bearish bias and less than 20% probability of a meaningful upside breakout.
Revenue outperformance and AI rollout fuel commercial momentum
Palantir Technologies Inc. delivered strong results in its third quarter of 2025, with revenue reaching $1.181 billion and non-GAAP EPS of $0.21, both outpacing expectations. The company saw U.S. commercial revenue surge 121% year-over-year and secured additional momentum in its government business, including large multi-year contracts such as a U.S. Army agreement. The launch of the Artificial Intelligence Platform (AIP) and the company’s robust cash position of $6.4 billion supported continued expansion across commercial and governmental sectors.
Sustained sell bias and oversold signals amid intraday volatility
Momentum indicators signal weakness, with the MACD showing a persistent sell bias and the ADX indicating a weak, non-trending market. The RSI, Stochastic RSI, and CCI all indicate oversold conditions, suggesting price exhaustion from sellers, while the Bull/Bear Power shows dominance by sellers intraday. The Awesome Oscillator also supports the selling trend. PLTR dropped 3.23% today with a daily change of $5.35 down, opening with a slight gap lower and now trading near the day’s low of $160.66, reflecting high intraday volatility and sustained pressure after the open. The alignment of weak momentum with negative intraday tone underscores broad selling activity, though oversold readings suggest a possible pause or rebound in the near term.
Sideways range likely as technicals dampen breakout prospects
For the next 5 trading days, a price band shaped by typical volatility lies between $150.00 and $166.00 based on the current setup and historical movement. The probability of a significant upward move remains low (less than 20%), as technical indicators on weekly charts lack buy signals. The baseline scenario is a sideways corridor from $150.00 to $166.00, with bullish momentum only signaled if PLTR breaks above $166.00 resistance, while a drop below $150.00 could trigger tests of lower supports.
Last time, analysts noted that Palantir Technologies is trading below its short- and medium-term moving averages but remains well supported above the long-term MA-200, reflecting ongoing near-term selling pressure amid a stable long-term trend. Technical indicators such as a bearish MACD, weak ADX, and multiple oversold oscillators highlight prevailing seller control, with the stock facing resistance at $180 and support near $156.71.


-
 Afghanistan
-
 Albania
-
 Algeria
-
 Angola
-
 Argentina
-
 Armenia
-
 Australia
-
 Austria
-
 Azerbaijan
-
 Bahamas
-
 Bahrain
-
 Bangladesh
-
 Belarus
-
 Belgium
-
 Bolivia
-
 Botswana
-
 Brazil
-
 Brunei
-
 Bulgaria
-
 Cambodia
-
 Cameroon
-
 Canada
-
 Chile
Chile
-
 China
China
-
 Colombia
-
 Congo
Congo
-
 Costa Rica
-
 Cote d'Ivoire
-
 Croatia
-
 Cuba
Cuba
-
 Cyprus
-
 Czechia
-
 DR Congo
-
 Denmark
-
 Dominican Republic
-
 Ecuador
-
 Egypt
Egypt
-
 El Salvador
-
 Estonia
-
 Eswatini
-
 Ethiopia
-
 Finland
-
 France
-
 Georgia
-
 Germany
-
 Ghana
Ghana
-
 Greece
-
 Haiti
Haiti
-
 Hong Kong
-
 Hungary
-
 India
India
-
 Indonesia
-
 Iran, Islamic republic
-
 Iraq
Iraq
-
 Ireland
-
 Israel
-
 Italy
Italy
-
 Jamaica
-
 Japan
Japan
-
 Jordan
-
 Kazakhstan
-
 Kenya
Kenya
-
 Korea
Korea
-
 Kuwait
-
 Kyrgyzstan
-
 Laos
Laos
-
 Latvia
-
 Lebanon
-
 Lesotho
-
 Libya
Libya
-
 Lithuania
-
 Luxembourg
-
 Madagascar
-
 Malaysia
-
 Malta
Malta
-
 Mauritius
-
 Mexico
-
 Moldova
-
 Mongolia
-
 Montenegro
-
 Morocco
-
 Mozambique
-
 Myanmar
-
 Namibia
-
 Nepal
Nepal
-
 Netherlands
-
 New Zealand
-
 Nigeria
-
 North Macedonia
-
 Norway
-
 Oman
Oman
-
 Pakistan
-
 Palestine
-
 Panama
-
 Papua New Guinea
-
 Paraguay
-
 Peru
Peru
-
 Philippines
-
 Poland
-
 Portugal
-
 Puerto Rico
-
 Qatar
Qatar
-
 Reunion
-
 Romania
-
 Rwanda
-
 Saudi Arabia
-
 Serbia
-
 Singapore
-
 Slovakia
-
 Slovenia
-
 Somalia
-
 South Africa
-
 Spain
Spain
-
 Sri Lanka
-
 Sweden
-
 Switzerland
-
 Syria
Syria
-
 Taiwan
-
 Tajikistan
-
 Tanzania
-
 Thailand
-
 Trinidad and Tobago
-
 Tunisia
-
 Turkey
-
 UAE
UAE
-
 Uganda
-
 Ukraine
-
 United Kingdom
-
United States
-
 Uruguay
-
 Uzbekistan
-
 Venezuela
-
 Vietnam
-
 Yemen
Yemen
-
 Zambia
-
 Zimbabwe
- Forex
- Crypto
