
Palantir stock: enterprise deals and key AI status fuel a 3.30% gain

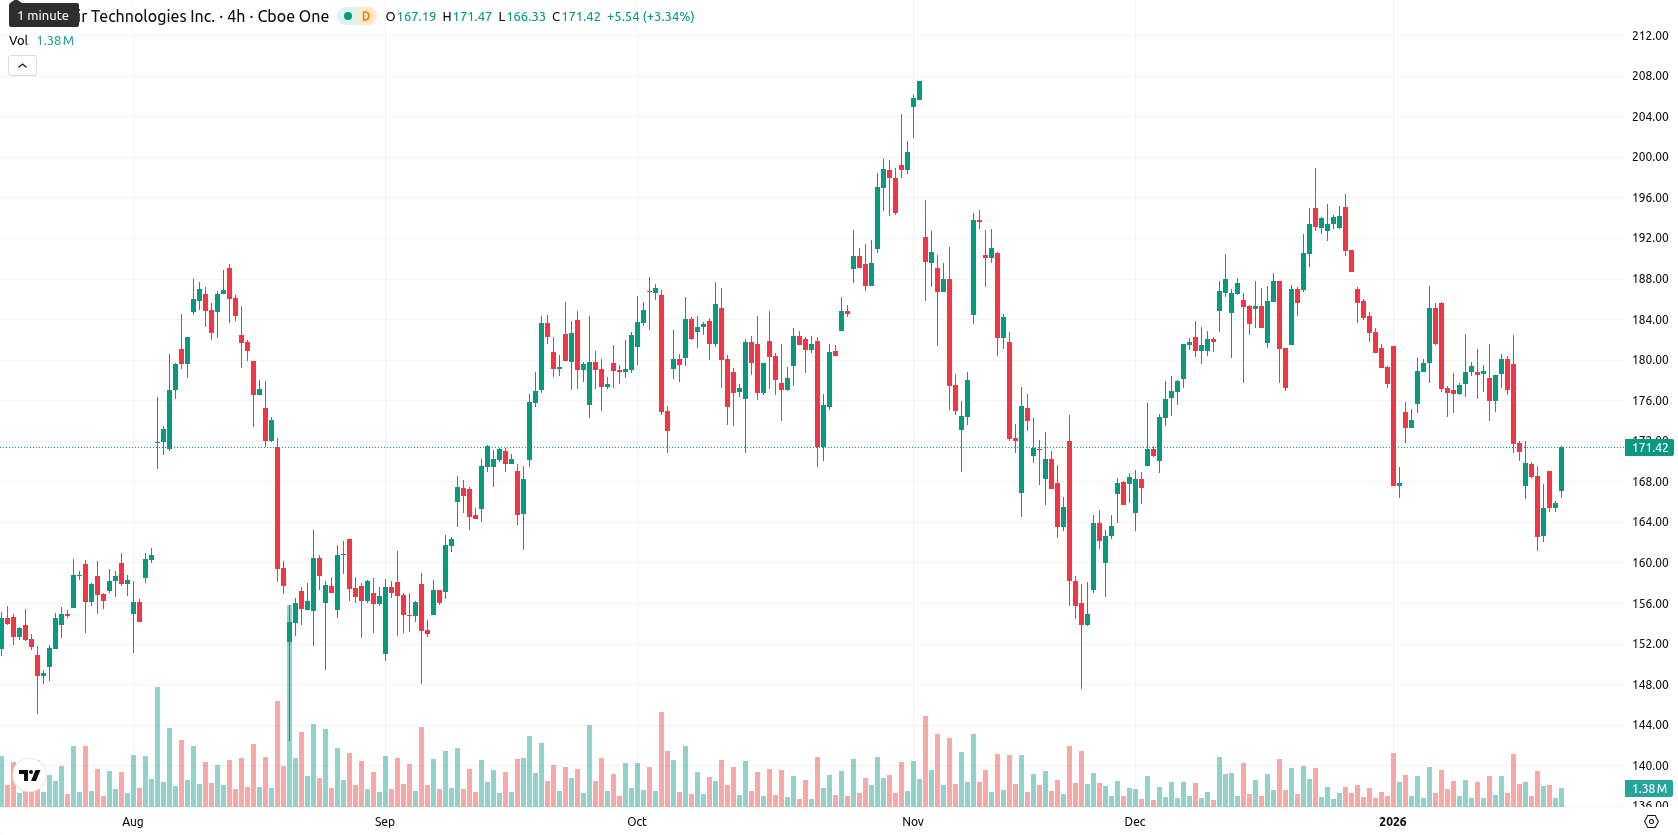
Palantir Technologies Inc (PLTR) is currently trading at $171.31, below the MA-20 ($178.10) and MA-50 ($177.38), but well above the MA-200 ($156.71). This setup indicates short- and medium-term selling pressure, while the long-term trend remains supported against the key MA-200 area.
Highlights
- Palantir (PLTR) trades at $171.31, below its MA-20 ($178.10) and MA-50 ($177.38), but remains well above the MA-200 ($156.71), reflecting ongoing short- and medium-term seller pressure amid long-term support.
- Momentum indicators are mixed, with bearish MACD, neutral ADX, and multiple oversold signals (RSI 36.77, Stochastic RSI 5.05, CCI –148.38), while Awesome Oscillator and Bull/Bear Power confirm prevailing seller dominance.
- Expected five-day price range is $166.00–$178.00, with a less than 20% probability of a rise, sideways movement likely, and breakout levels at $180.00 (bullish) and $166.00 (bearish).
Commercial wins and AI recognition bolster earnings optimism
Palantir has expanded its commercial reach by securing a major deal with Hyundai, reinforcing its presence in enterprise AI solutions. The company is also preparing to report earnings on February 2, 2026, with expectations for continued revenue and cash flow growth. Recent recognition as a key player in the AI sector further supports Palantir's strategic momentum.
Oversold signals persist as sellers dominate below resistance levels
Technical levels show PLTR facing resistance near the Ichimoku Kijun at $180.00 and support at the MA-200 around $156.71. The MACD on the D1 is bearish, and the ADX remains neutral, indicating weak trend strength. Oscillators, including the RSI at 36.77, Stochastic RSI at 5.05, and CCI at –148.38, all suggest oversold conditions, while Bull/Bear Power and the Awesome Oscillator confirm seller control.
Sideways bias likely as volatility limits bullish breakout potential
In the coming days, typical volatility suggests a price range of $166.00 – $178.00, with a low probability (less than 20%) of a near-term rise. Sideways movement is the baseline scenario as oversold conditions may help stabilize prices. A bullish move requires a clear breakout above $180.00, while a bearish scenario could unfold if $166.00 support fails, targeting the MA-200 region.


-
 Afghanistan
-
 Albania
-
 Algeria
-
 Angola
-
 Argentina
-
 Armenia
-
 Australia
-
 Austria
-
 Azerbaijan
-
 Bahamas
-
 Bahrain
-
 Bangladesh
-
 Belarus
-
 Belgium
-
 Bolivia
-
 Botswana
-
 Brazil
-
 Brunei
-
 Bulgaria
-
 Cambodia
-
 Cameroon
-
 Canada
-
 Chile
Chile
-
 China
China
-
 Colombia
-
 Congo
Congo
-
 Costa Rica
-
 Cote d'Ivoire
-
 Croatia
-
 Cuba
Cuba
-
 Cyprus
-
 Czechia
-
 DR Congo
-
 Denmark
-
 Dominican Republic
-
 Ecuador
-
 Egypt
Egypt
-
 El Salvador
-
 Estonia
-
 Eswatini
-
 Ethiopia
-
 Finland
-
 France
-
 Georgia
-
 Germany
-
 Ghana
Ghana
-
 Greece
-
 Haiti
Haiti
-
 Hong Kong
-
 Hungary
-
 India
India
-
 Indonesia
-
 Iran, Islamic republic
-
 Iraq
Iraq
-
 Ireland
-
 Israel
-
 Italy
Italy
-
 Jamaica
-
 Japan
Japan
-
 Jordan
-
 Kazakhstan
-
 Kenya
Kenya
-
 Korea
Korea
-
 Kuwait
-
 Kyrgyzstan
-
 Laos
Laos
-
 Latvia
-
 Lebanon
-
 Lesotho
-
 Libya
Libya
-
 Lithuania
-
 Luxembourg
-
 Madagascar
-
 Malaysia
-
 Malta
Malta
-
 Mauritius
-
 Mexico
-
 Moldova
-
 Mongolia
-
 Montenegro
-
 Morocco
-
 Mozambique
-
 Myanmar
-
 Namibia
-
 Nepal
Nepal
-
 Netherlands
-
 New Zealand
-
 Nigeria
-
 North Macedonia
-
 Norway
-
 Oman
Oman
-
 Pakistan
-
 Palestine
-
 Panama
-
 Papua New Guinea
-
 Paraguay
-
 Peru
Peru
-
 Philippines
-
 Poland
-
 Portugal
-
 Puerto Rico
-
 Qatar
Qatar
-
 Reunion
-
 Romania
-
 Rwanda
-
 Saudi Arabia
-
 Serbia
-
 Singapore
-
 Slovakia
-
 Slovenia
-
 Somalia
-
 South Africa
-
 Spain
Spain
-
 Sri Lanka
-
 Sweden
-
 Switzerland
-
 Syria
Syria
-
 Taiwan
-
 Tajikistan
-
 Tanzania
-
 Thailand
-
 Trinidad and Tobago
-
 Tunisia
-
 Turkey
-
 UAE
UAE
-
 Uganda
-
 Ukraine
-
 United Kingdom
-
United States
-
 Uruguay
-
 Uzbekistan
-
 Venezuela
-
 Vietnam
-
 Yemen
Yemen
-
 Zambia
-
 Zimbabwe
- Forex
- Crypto
