
-5.75% for Hut 8 stock — normalization after bullish multi-timeframe trend

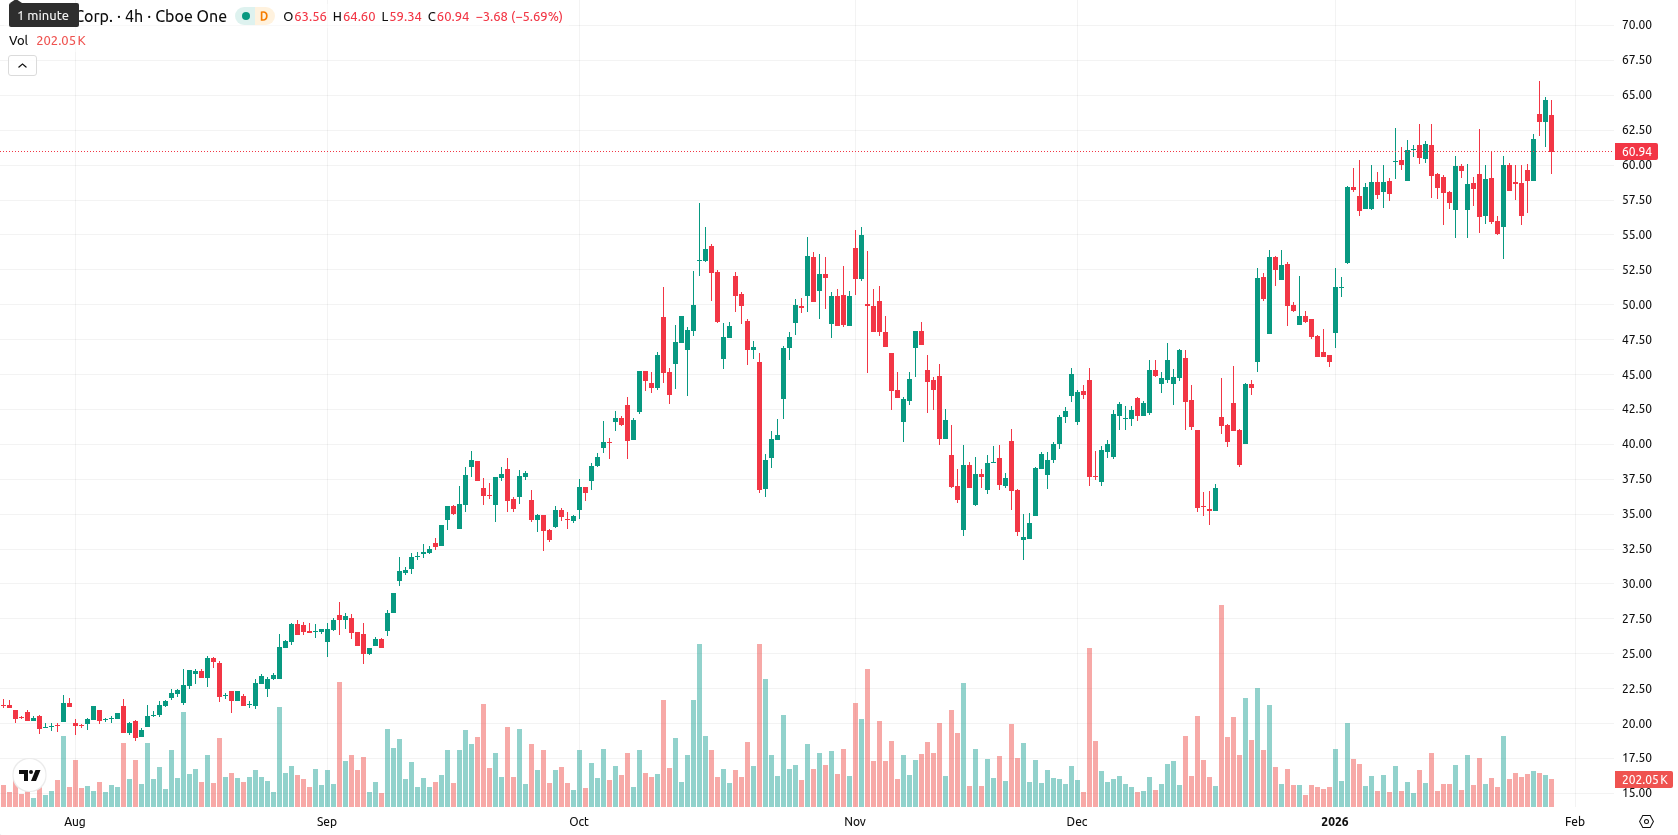
Hut 8 Corp (HUT) trades at $60.89, which is well above its MA-20 ($57.36), MA-50 ($48.21), and MA-200 ($31.65), confirming a bullish structure across short, medium, and long-term trends. The price dropped $3.72 or 5.75% today and is now sitting near the lower end of today's range after considerable intraday volatility.
Highlights
- Hut 8 (HUT) trades at $60.89, well above its MA-20 ($57.36), MA-50 ($48.21), and MA-200 ($31.65), confirming a bullish structure across all timeframes.
- Momentum indicators are mixed—MACD signals strong buy, ADX is neutral, and short-term oscillators diverge, with CCI and Bull/Bear Power both overbought.
- For the next five days, Hut 8 is expected to consolidate between $59.25 and $60.84, with more than 80% probability of a price increase.
Mixed momentum and overbought signals complicate support outlook
The nearest dynamic support level is the Ichimoku Kijun at $52.97, while resistance appears near the MA-50 at $48.21 and the next round levels above the current price. Momentum readings are mixed: MACD on D1 signals a strong buy while the ADX is neutral, showing limited trend strength despite bullish momentum. RSI suggests mild buying pressure but remains below overbought, Stochastic RSI is neutral, and the CCI is overbought. Bull/Bear Power is also overbought at 7.30, showing buyers retain intraday dominance, yet short-term oscillators diverge with one neutral and another overbought; the Awesome Oscillator is neutral with no clear trend confirmation.
Sideways bias as upside breakout outweighs downside risk
For the next five trading days, the typical volatility band is $59.25–$60.84, closely following current levels as price action normalizes. There is a very high probability of a price increase of over 80% based on four weekly signals, with declines considered less likely. The baseline scenario expects sideways consolidation around the current band. Bullish moves would target a breakout above $60.84, while bearish developments could push the price below support at $59.25.
Previously it was reported that Hut 8 Corp maintains a bullish structure, with shares trading well above all major moving averages despite a recent session decline. However, mixed momentum signals—including a strong MACD but weak ADX and overbought indicators—suggest the possibility of near-term consolidation as the price approaches key resistance near the $65 level.


-
 Afghanistan
-
 Albania
-
 Algeria
-
 Angola
-
 Argentina
-
 Armenia
-
 Australia
-
 Austria
-
 Azerbaijan
-
 Bahamas
-
 Bahrain
-
 Bangladesh
-
 Belarus
-
 Belgium
-
 Bolivia
-
 Botswana
-
 Brazil
-
 Brunei
-
 Bulgaria
-
 Cambodia
-
 Cameroon
-
 Canada
-
 Chile
Chile
-
 China
China
-
 Colombia
-
 Congo
Congo
-
 Costa Rica
-
 Cote d'Ivoire
-
 Croatia
-
 Cuba
Cuba
-
 Cyprus
-
 Czechia
-
 DR Congo
-
 Denmark
-
 Dominican Republic
-
 Ecuador
-
 Egypt
Egypt
-
 El Salvador
-
 Estonia
-
 Eswatini
-
 Ethiopia
-
 Finland
-
 France
-
 Georgia
-
 Germany
-
 Ghana
Ghana
-
 Greece
-
 Haiti
Haiti
-
 Hong Kong
-
 Hungary
-
 India
India
-
 Indonesia
-
 Iran, Islamic republic
-
 Iraq
Iraq
-
 Ireland
-
 Israel
-
 Italy
Italy
-
 Jamaica
-
 Japan
Japan
-
 Jordan
-
 Kazakhstan
-
 Kenya
Kenya
-
 Korea
Korea
-
 Kuwait
-
 Kyrgyzstan
-
 Laos
Laos
-
 Latvia
-
 Lebanon
-
 Lesotho
-
 Libya
Libya
-
 Lithuania
-
 Luxembourg
-
 Madagascar
-
 Malaysia
-
 Malta
Malta
-
 Mauritius
-
 Mexico
-
 Moldova
-
 Mongolia
-
 Montenegro
-
 Morocco
-
 Mozambique
-
 Myanmar
-
 Namibia
-
 Nepal
Nepal
-
 Netherlands
-
 New Zealand
-
 Nigeria
-
 North Macedonia
-
 Norway
-
 Oman
Oman
-
 Pakistan
-
 Palestine
-
 Panama
-
 Papua New Guinea
-
 Paraguay
-
 Peru
Peru
-
 Philippines
-
 Poland
-
 Portugal
-
 Puerto Rico
-
 Qatar
Qatar
-
 Reunion
-
 Romania
-
 Rwanda
-
 Saudi Arabia
-
 Serbia
-
 Singapore
-
 Slovakia
-
 Slovenia
-
 Somalia
-
 South Africa
-
 Spain
Spain
-
 Sri Lanka
-
 Sweden
-
 Switzerland
-
 Syria
Syria
-
 Taiwan
-
 Tajikistan
-
 Tanzania
-
 Thailand
-
 Trinidad and Tobago
-
 Tunisia
-
 Turkey
-
 UAE
UAE
-
 Uganda
-
 Ukraine
-
 United Kingdom
-
United States
-
 Uruguay
-
 Uzbekistan
-
 Venezuela
-
 Vietnam
-
 Yemen
Yemen
-
 Zambia
-
 Zimbabwe
- Forex
- Crypto
