
AMD stock drops 3.53% as mixed technicals and upcoming earnings weigh on sentiment

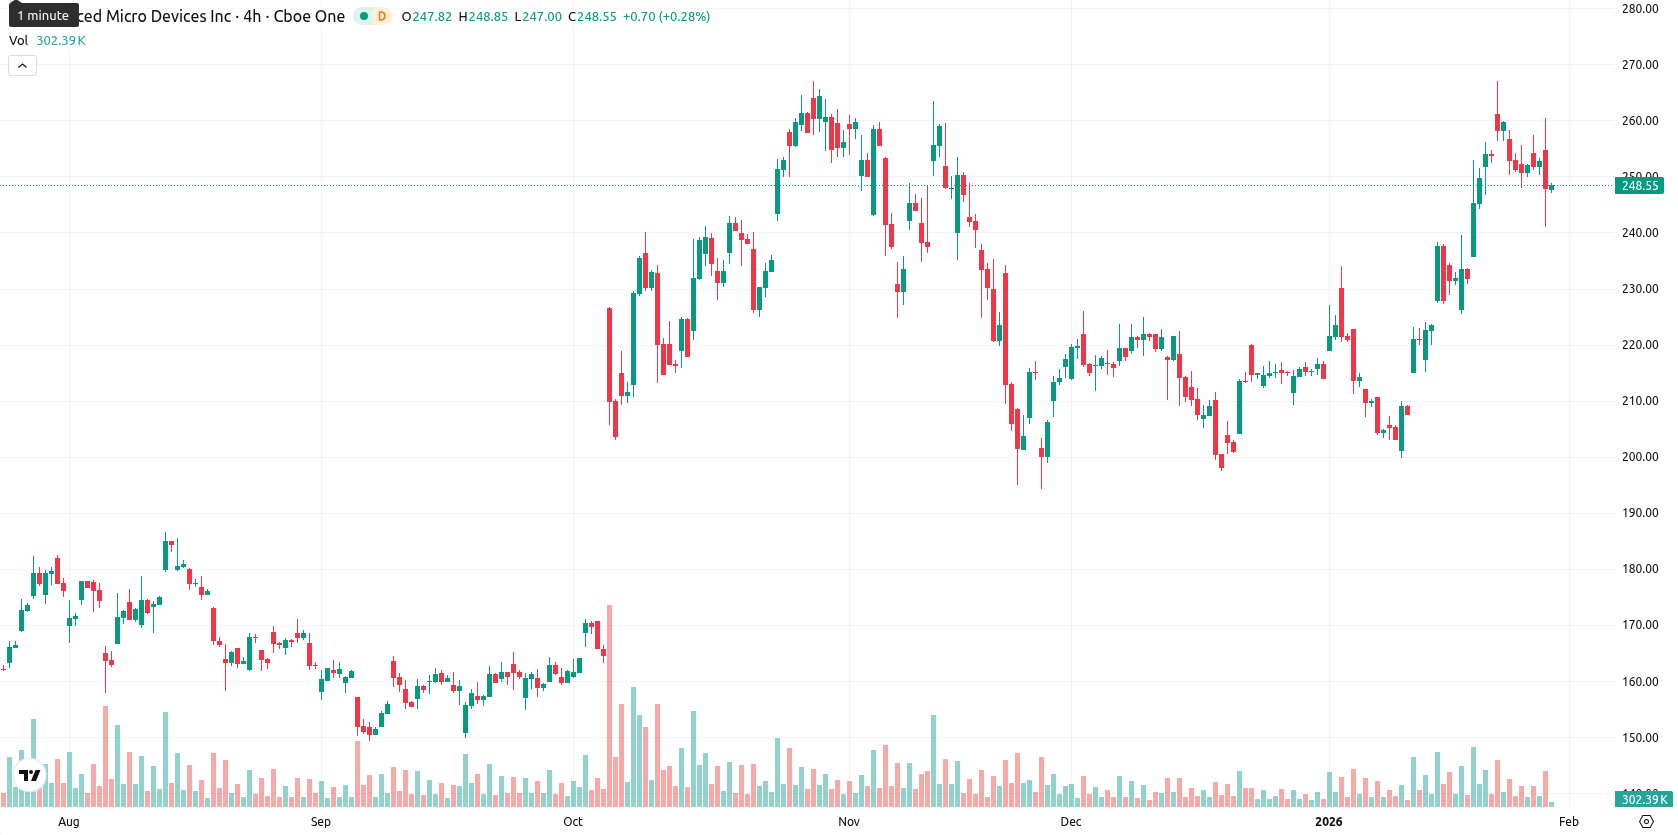
Advanced Micro Devices, Inc. (AMD) is trading at $243.83, keeping well above the MA-20 at $228.47, MA-50 at $221.21, and MA-200 at $174.29. This positioning confirms a bullish structure across short-, medium-, and long-term timeframes, with dynamic support now at the Ichimoku Kijun ($233.35) and resistance near the MA-50 ($221.21) acting as a distant floor.
Highlights
- AMD will report fourth-quarter and full-year 2025 earnings after the U.S. market closes on Tuesday, providing vital updates on AI semiconductor progress.
- A subsequent quarterly report scheduled for February 3, 2026, offers another data point to gauge AMD’s business momentum and investor sentiment.
- AMD trades at $243.83, remaining above MA-20 ($228.47), MA-50 ($221.21), and MA-200 ($174.29), confirming a bullish trend with near-term support at $233.35.
Earnings releases drive investor focus on AI growth prospects
AMD is set to release its fourth-quarter and full-year 2025 earnings after the U.S. market closes on Tuesday, which will shed light on recent performance and progress in the artificial intelligence semiconductor segment. A second quarterly report is also announced for February 3, 2026, providing another milestone in assessing business momentum. These scheduled financial disclosures are in focus for investors tracking AMD's fundamental trajectory.
Diverging momentum and overbought signals test bullish resilience
Momentum metrics present a mixed view: MACD is positive, indicating upside momentum, while ADX remains weak, signaling the trend is not particularly strong. Overbought conditions are evident in the Commodity Channel Index and Bull/Bear Power, but RSI is not yet at an extreme, and Stochastic RSI is neutral, flagging the risk of short-term pullbacks. Bull/Bear Power shows continued buyer dominance, though the Awesome Oscillator supports the prevailing upward trend. The price opened with a gap up from yesterday’s close, but has since slipped 3.53%, drifting from near today’s high to the lower end of its range, with volatility elevated and pressure clearly evident after the open. Divergence between persistent bullish momentum signals and overbought oscillators warrants caution, as short-term weakness may not yet signal a full reversal.
High probability of sideways action amid upside breakout hopes
For the next five sessions, the expected price range is $235 to $255, reflecting AMD’s typical volatility band relative to current levels. The probability of a price increase is high (80%), with the opposite movement less likely, given bullish readings on most weekly indicators. The baseline scenario calls for sideways movement within this corridor. A bullish outcome sees AMD breaking above $255 resistance and targeting higher levels if buyer pressure persists, while a break below $235 support could prompt a deeper pullback toward medium-term averages.
Previously it was reported that Advanced Micro Devices, Inc. is exhibiting a strong bullish trend, currently trading well above its major moving averages, though several momentum indicators such as RSI and Stochastic RSI signal overbought conditions. Key support is identified near the Ichimoku Kijun level, with consolidation expected between $245 and $265, while further upside could follow if resistance is breached.


Latest AMD News


-
 Afghanistan
-
 Albania
-
 Algeria
-
 Angola
-
 Argentina
-
 Armenia
-
 Australia
-
 Austria
-
 Azerbaijan
-
 Bahamas
-
 Bahrain
-
 Bangladesh
-
 Belarus
-
 Belgium
-
 Bolivia
-
 Botswana
-
 Brazil
-
 Brunei
-
 Bulgaria
-
 Cambodia
-
 Cameroon
-
 Canada
-
 Chile
Chile
-
 China
China
-
 Colombia
-
 Congo
Congo
-
 Costa Rica
-
 Cote d'Ivoire
-
 Croatia
-
 Cuba
Cuba
-
 Cyprus
-
 Czechia
-
 DR Congo
-
 Denmark
-
 Dominican Republic
-
 Ecuador
-
 Egypt
Egypt
-
 El Salvador
-
 Estonia
-
 Eswatini
-
 Ethiopia
-
 Finland
-
 France
-
 Georgia
-
 Germany
-
 Ghana
Ghana
-
 Greece
-
 Haiti
Haiti
-
 Hong Kong
-
 Hungary
-
 India
India
-
 Indonesia
-
 Iran, Islamic republic
-
 Iraq
Iraq
-
 Ireland
-
 Israel
-
 Italy
Italy
-
 Jamaica
-
 Japan
Japan
-
 Jordan
-
 Kazakhstan
-
 Kenya
Kenya
-
 Korea
Korea
-
 Kuwait
-
 Kyrgyzstan
-
 Laos
Laos
-
 Latvia
-
 Lebanon
-
 Lesotho
-
 Libya
Libya
-
 Lithuania
-
 Luxembourg
-
 Madagascar
-
 Malaysia
-
 Malta
Malta
-
 Mauritius
-
 Mexico
-
 Moldova
-
 Mongolia
-
 Montenegro
-
 Morocco
-
 Mozambique
-
 Myanmar
-
 Namibia
-
 Nepal
Nepal
-
 Netherlands
-
 New Zealand
-
 Nigeria
-
 North Macedonia
-
 Norway
-
 Oman
Oman
-
 Pakistan
-
 Palestine
-
 Panama
-
 Papua New Guinea
-
 Paraguay
-
 Peru
Peru
-
 Philippines
-
 Poland
-
 Portugal
-
 Puerto Rico
-
 Qatar
Qatar
-
 Reunion
-
 Romania
-
 Rwanda
-
 Saudi Arabia
-
 Serbia
-
 Singapore
-
 Slovakia
-
 Slovenia
-
 Somalia
-
 South Africa
-
 Spain
Spain
-
 Sri Lanka
-
 Sweden
-
 Switzerland
-
 Syria
Syria
-
 Taiwan
-
 Tajikistan
-
 Tanzania
-
 Thailand
-
 Trinidad and Tobago
-
 Tunisia
-
 Turkey
-
 UAE
UAE
-
 Uganda
-
 Ukraine
-
 United Kingdom
-
United States
-
 Uruguay
-
 Uzbekistan
-
 Venezuela
-
 Vietnam
-
 Yemen
Yemen
-
 Zambia
-
 Zimbabwe
- Forex
- Crypto
