
AMD weekly outlook: slips 5.89% as investors await Q4 earnings and outlook update

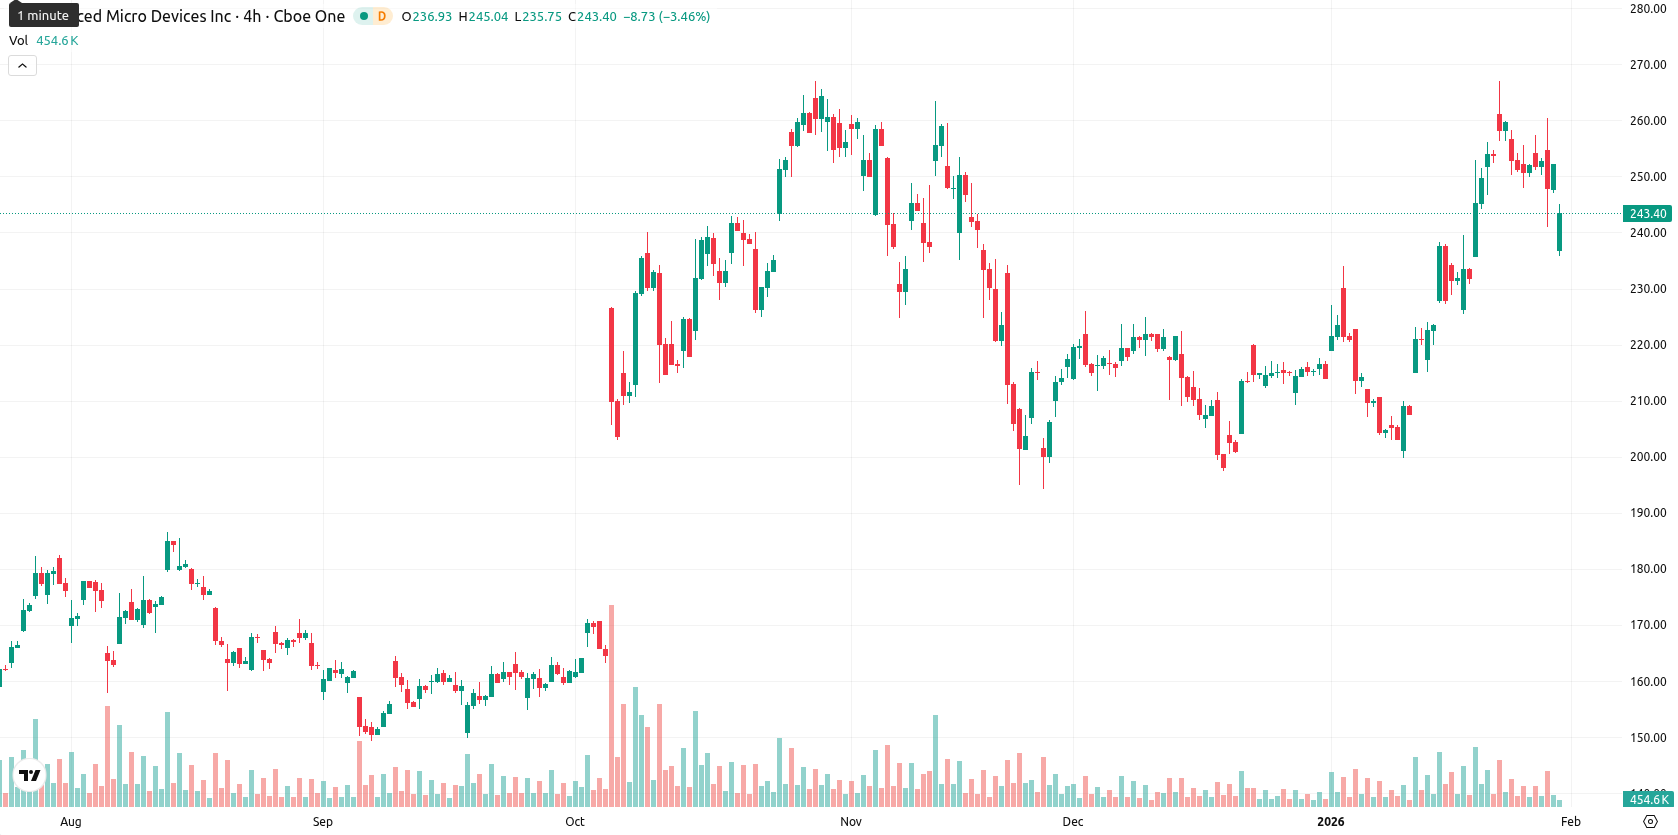
Advanced Micro Devices, Inc. (AMD) finished the week at $243.57, reflecting a decline of $8.61 or 3.41% from last week's close of $252.18. The asset currently trades above its weekly MA-20 at $230.31, MA-50 at $221.32, and MA-200 at $175.09, maintaining a strong position above all major weekly moving averages.
Highlights
- AMD trades at $243.57, above the MA-20 ($230.31), MA-50 ($221.32), and MA-200 ($175.09), signaling a bullish trend across all timeframes.
- Despite bullish momentum signals from MACD and RSI, daily price declined 3.41% after a gap-down open, with intraday volatility elevated and mixed sentiment.
- Critical technical levels are resistance at $254.00 and support at $235.00, with an 80% probability of price moving higher within a $235.00–$254.00 range over the next five days.
Earnings anticipation and AI strength drive investor positioning this week
AMD is set to report fourth-quarter and full-year financial results after the market closes on Tuesday, February 3, which is a primary focus for investors this week. Momentum continues in AMD's AI, server, and PC businesses, supported by strength in EPYC processors and Instinct GPUs and favorable demand trends. The company also completed its acquisition of ZT Systems, expanding its portfolio in rack-scale AI server design, while attention grows around potential server CPU market share shifts following recent sector developments.
Bullish weekly setup sustained amid weak trend signals and overbought risks
On the weekly chart, AMD holds a bullish technical setup as the price remains above the MA-20 ($230.31), MA-50 ($221.32), and MA-200 ($175.09), with the nearest dynamic support at the Ichimoku Kijun level ($233.35) and secondary support at the MA-50 ($221.32). Weekly momentum signals are moderately bullish, supported by weekly RSI and CCI readings, although the ADX at 17.49 points to a weak trend and some overbought indications persist. Weekly resistance is found near $254.00, while key support rests at $235.00 and, if breached, at the Kijun and MA-50 levels.
Range-bound bias expected as overbought tensions temper breakout odds
For the coming week, AMD’s price is expected to trade within a realistic range of $235.00 to $254.00 as sideways consolidation resolves. There is a high probability (80%) of upward movement, but persistent overbought readings and mixed short-term momentum could lead to range-bound trading. A decisive breakout above $254.00 would confirm renewed bullish momentum, while a close below $235.00 may expose the stock to further declines toward its weekly support zone.
Previously it was reported that AMD maintains a bullish structure, trading well above its key moving averages with dynamic support at the Ichimoku Kijun, while momentum signals such as a positive MACD contrast with mixed readings from overbought oscillators and elevated intraday volatility. Consolidation is expected within a broad range, with resistance near $255 and potential for volatility-driven pullbacks, as sellers exert near-term pressure despite the underlying constructive trend.


Latest AMD News


-
 Afghanistan
-
 Albania
-
 Algeria
-
 Angola
-
 Argentina
-
 Armenia
-
 Australia
-
 Austria
-
 Azerbaijan
-
 Bahamas
-
 Bahrain
-
 Bangladesh
-
 Belarus
-
 Belgium
-
 Bolivia
-
 Botswana
-
 Brazil
-
 Brunei
-
 Bulgaria
-
 Cambodia
-
 Cameroon
-
 Canada
-
 Chile
Chile
-
 China
China
-
 Colombia
-
 Congo
Congo
-
 Costa Rica
-
 Cote d'Ivoire
-
 Croatia
-
 Cuba
Cuba
-
 Cyprus
-
 Czechia
-
 DR Congo
-
 Denmark
-
 Dominican Republic
-
 Ecuador
-
 Egypt
Egypt
-
 El Salvador
-
 Estonia
-
 Eswatini
-
 Ethiopia
-
 Finland
-
 France
-
 Georgia
-
 Germany
-
 Ghana
Ghana
-
 Greece
-
 Haiti
Haiti
-
 Hong Kong
-
 Hungary
-
 India
India
-
 Indonesia
-
 Iran, Islamic republic
-
 Iraq
Iraq
-
 Ireland
-
 Israel
-
 Italy
Italy
-
 Jamaica
-
 Japan
Japan
-
 Jordan
-
 Kazakhstan
-
 Kenya
Kenya
-
 Korea
Korea
-
 Kuwait
-
 Kyrgyzstan
-
 Laos
Laos
-
 Latvia
-
 Lebanon
-
 Lesotho
-
 Libya
Libya
-
 Lithuania
-
 Luxembourg
-
 Madagascar
-
 Malaysia
-
 Malta
Malta
-
 Mauritius
-
 Mexico
-
 Moldova
-
 Mongolia
-
 Montenegro
-
 Morocco
-
 Mozambique
-
 Myanmar
-
 Namibia
-
 Nepal
Nepal
-
 Netherlands
-
 New Zealand
-
 Nigeria
-
 North Macedonia
-
 Norway
-
 Oman
Oman
-
 Pakistan
-
 Palestine
-
 Panama
-
 Papua New Guinea
-
 Paraguay
-
 Peru
Peru
-
 Philippines
-
 Poland
-
 Portugal
-
 Puerto Rico
-
 Qatar
Qatar
-
 Reunion
-
 Romania
-
 Rwanda
-
 Saudi Arabia
-
 Serbia
-
 Singapore
-
 Slovakia
-
 Slovenia
-
 Somalia
-
 South Africa
-
 Spain
Spain
-
 Sri Lanka
-
 Sweden
-
 Switzerland
-
 Syria
Syria
-
 Taiwan
-
 Tajikistan
-
 Tanzania
-
 Thailand
-
 Trinidad and Tobago
-
 Tunisia
-
 Turkey
-
 UAE
UAE
-
 Uganda
-
 Ukraine
-
 United Kingdom
-
United States
-
 Uruguay
-
 Uzbekistan
-
 Venezuela
-
 Vietnam
-
 Yemen
Yemen
-
 Zambia
-
 Zimbabwe
- Forex
- Crypto
