
Intuit weekly forecast: downside risk persists with no strong support above $485

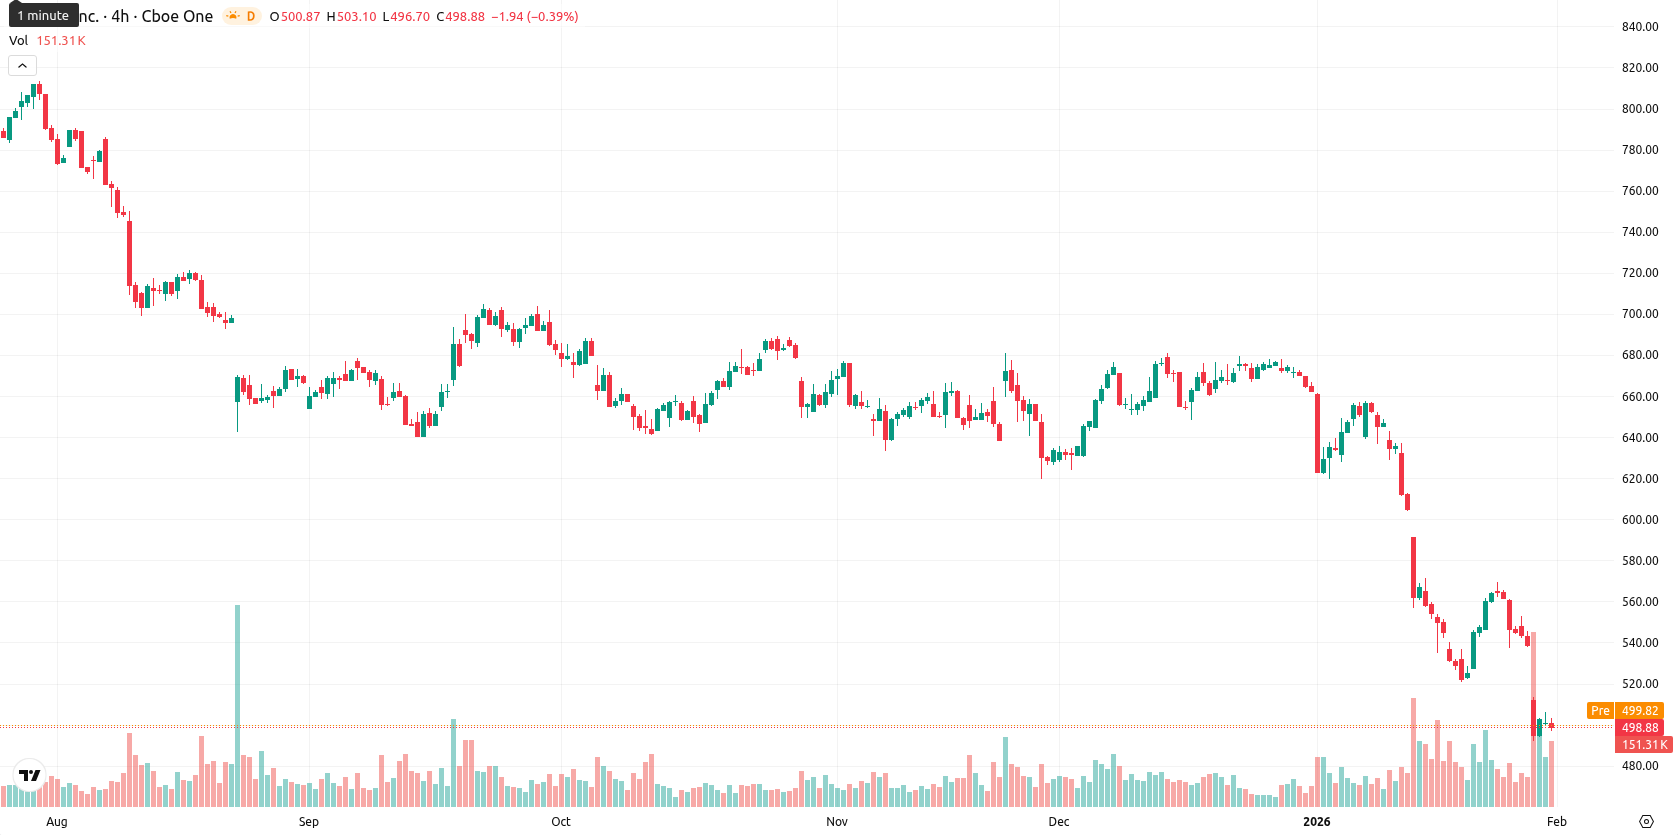
Intuit Inc. (INTU) closed the week at $498.48, marking a decline of $4.50 or 0.89% over the past seven days. The asset remains well below its weekly MA-20 ($579.06), MA-50 ($627.03), and MA-200 ($680.58), confirming persistent downside pressure across all major trend horizons.
Highlights
- The price at $498.48 remains significantly below the MA-20 ($579.06), MA-50 ($627.03), and MA-200 ($680.58), reflecting persistent downside pressure across all timeframes.
- Daily and weekly momentum indicators, including MACD, ADX, RSI (24.22), and CCI (-113.63), confirm strong bearish dominance and a deeply oversold condition.
- Next five trading days are expected within a $485–$510 range, with less than a 20% probability of a sustained upside and heightened risk of breakdown below $485 due to lack of nearby support.
Strategic integrations and shifting investor stakes shape sentiment during the week
Digit, a manufacturing and inventory operations platform, became available on the Intuit QuickBooks Online App Store, providing enhanced integration for small business customers. Principal Financial Group Inc. reported a modest reduction in its stake in Intuit during the third quarter, while Bryn Mawr Trust Advisors LLC substantially increased its holdings. These developments reflect continuing engagement with third-party developers and institutional investors.
Bearish momentum deepens as oversold signals and lost support intensify
Technical indicators on the weekly timeframe reinforce a bearish outlook, with the price holding below all key moving averages and hovering near recent lows. The Ichimoku Kijun at $585.15 acts as the nearest resistance level, while the absence of meaningful weekly support underlines ongoing vulnerability. Weekly RSI stands at a strongly oversold 24.22, CCI is at -113.63, MACD and ADX both confirm sustained bearish momentum, and the Awesome Oscillator remains negative, signaling persistent seller dominance.
Downside risk prevails next week as absence of support limits rebound hopes
Over the upcoming week, Intuit is expected to trade in a range between $485 and $510, with price likely stabilizing in a sideways channel unless key technical levels are breached. A sustained move above $510 — $520 would be required to shift sentiment and prompt short-covering, but current indicators assign a low probability to this scenario. Most signals favor continued downside risk, with any break below $485 potentially resulting in further rapid losses given the lack of nearby support.
Last time, analysts noted that Intuit Inc. is experiencing persistent downside pressure, with the current price sharply below all major moving averages and key momentum indicators including MACD and RSI near oversold levels. The shares now face resistance around $599.98 and remain under risk of further declines unless selling momentum reverses, with support identified near $495.


-
 Afghanistan
-
 Albania
-
 Algeria
-
 Angola
-
 Argentina
-
 Armenia
-
 Australia
-
 Austria
-
 Azerbaijan
-
 Bahamas
-
 Bahrain
-
 Bangladesh
-
 Belarus
-
 Belgium
-
 Bolivia
-
 Botswana
-
 Brazil
-
 Brunei
-
 Bulgaria
-
 Cambodia
-
 Cameroon
-
 Canada
-
 Chile
Chile
-
 China
China
-
 Colombia
-
 Congo
Congo
-
 Costa Rica
-
 Cote d'Ivoire
-
 Croatia
-
 Cuba
Cuba
-
 Cyprus
-
 Czechia
-
 DR Congo
-
 Denmark
-
 Dominican Republic
-
 Ecuador
-
 Egypt
Egypt
-
 El Salvador
-
 Estonia
-
 Eswatini
-
 Ethiopia
-
 Finland
-
 France
-
 Georgia
-
 Germany
-
 Ghana
Ghana
-
 Greece
-
 Haiti
Haiti
-
 Hong Kong
-
 Hungary
-
 India
India
-
 Indonesia
-
 Iran, Islamic republic
-
 Iraq
Iraq
-
 Ireland
-
 Israel
-
 Italy
Italy
-
 Jamaica
-
 Japan
Japan
-
 Jordan
-
 Kazakhstan
-
 Kenya
Kenya
-
 Korea
Korea
-
 Kuwait
-
 Kyrgyzstan
-
 Laos
Laos
-
 Latvia
-
 Lebanon
-
 Lesotho
-
 Libya
Libya
-
 Lithuania
-
 Luxembourg
-
 Madagascar
-
 Malaysia
-
 Malta
Malta
-
 Mauritius
-
 Mexico
-
 Moldova
-
 Mongolia
-
 Montenegro
-
 Morocco
-
 Mozambique
-
 Myanmar
-
 Namibia
-
 Nepal
Nepal
-
 Netherlands
-
 New Zealand
-
 Nigeria
-
 North Macedonia
-
 Norway
-
 Oman
Oman
-
 Pakistan
-
 Palestine
-
 Panama
-
 Papua New Guinea
-
 Paraguay
-
 Peru
Peru
-
 Philippines
-
 Poland
-
 Portugal
-
 Puerto Rico
-
 Qatar
Qatar
-
 Reunion
-
 Romania
-
 Rwanda
-
 Saudi Arabia
-
 Serbia
-
 Singapore
-
 Slovakia
-
 Slovenia
-
 Somalia
-
 South Africa
-
 Spain
Spain
-
 Sri Lanka
-
 Sweden
-
 Switzerland
-
 Syria
Syria
-
 Taiwan
-
 Tajikistan
-
 Tanzania
-
 Thailand
-
 Trinidad and Tobago
-
 Tunisia
-
 Turkey
-
 UAE
UAE
-
 Uganda
-
 Ukraine
-
 United Kingdom
-
United States
-
 Uruguay
-
 Uzbekistan
-
 Venezuela
-
 Vietnam
-
 Yemen
Yemen
-
 Zambia
-
 Zimbabwe
- Forex
- Crypto
