
JetBlue Airways stock price forecast: Sideways range expected as JBLU gains 5.88%

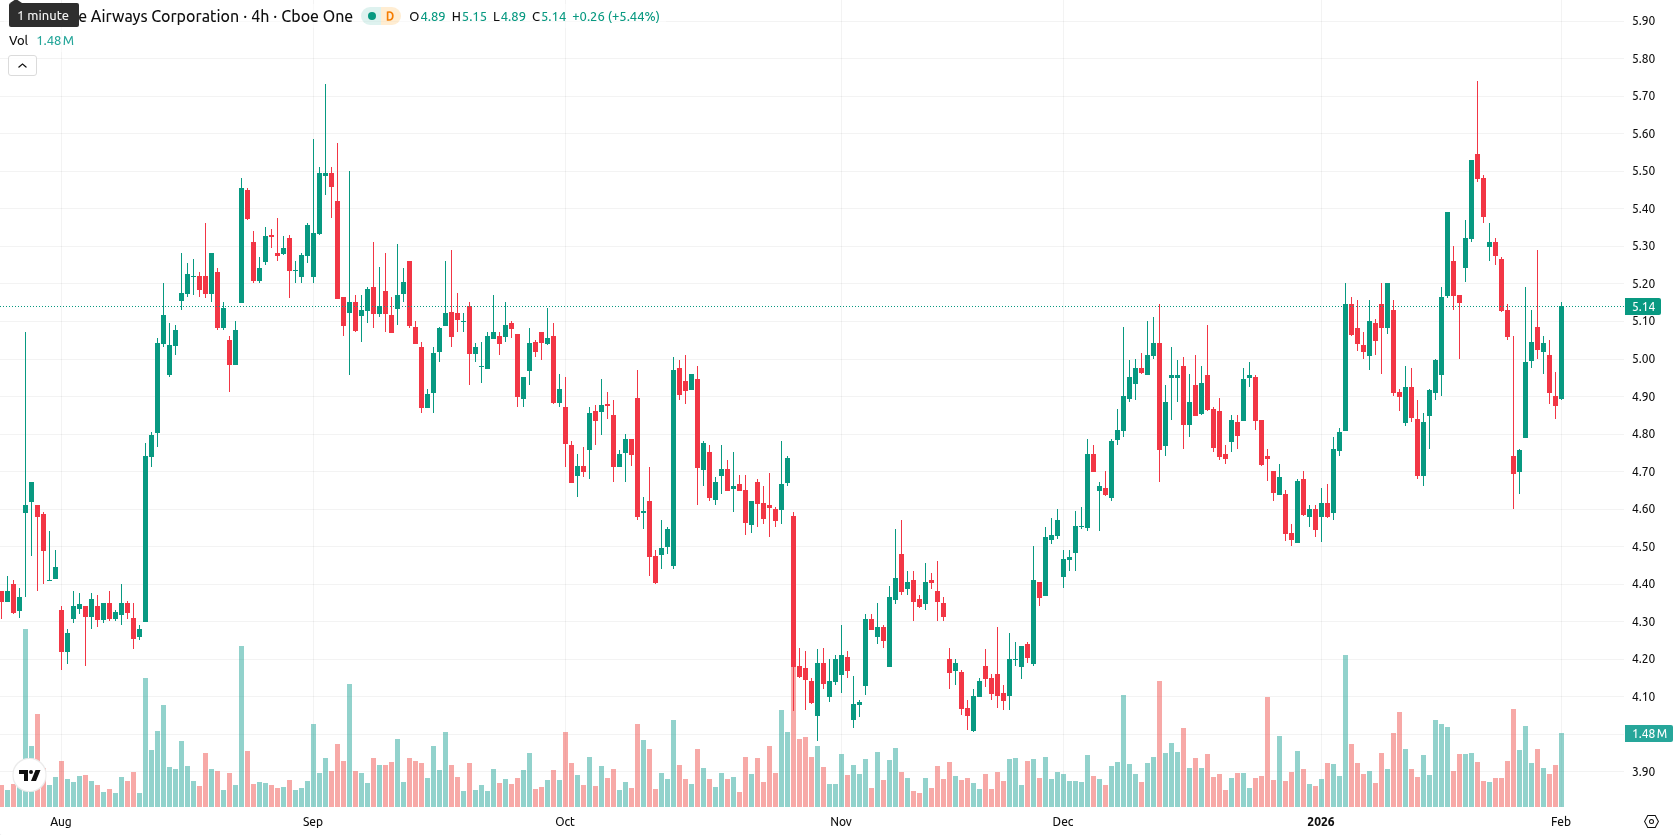
JetBlue Airways Corp (JBLU) is trading at $5.16, currently above the MA-20 ($5.04), MA-50 ($4.80), and MA-200 ($4.68), which indicates strengthening short-, medium-, and long-term trends. The nearest support is the Ichimoku Kijun ($5.13), while the next resistance aligns with the MA-50 and the round level at $5.20.
Highlights
- JBLU is trading at $5.16, above the MA-20 ($5.04), MA-50 ($4.80), and MA-200 ($4.68), reflecting strengthening trends across all timeframes.
- Key technical levels include support at the Ichimoku Kijun ($5.13) and resistance near the MA-50 and round number at $5.20.
- MACD shows a Strong Buy while Stochastic RSI is oversold, suggesting a potential short-term recovery within a projected $5.15–$5.59 trading range over the next five sessions.
Mixed momentum signals as intraday highs test resilience
Momentum is moderately positive, with the MACD on D1 giving a Strong Buy signal and the ADX reading indicating a weak trend. The RSI on D1 shows mild selling pressure but is not oversold, while the Stochastic RSI is registering oversold conditions, suggesting a potential recovery. Bull/Bear Power is in favor of buyers intraday, and a Neutral reading on the Awesome Oscillator does not undermine the current bullish tone. The price opened slightly above the previous close, forming a minimal gap, and is now trading near the high of the day with low intraday volatility. Strength toward session highs is evident, though some divergence appears as oscillators flash mixed momentum and oversold signals against today’s persistent upward move.
Sideways price outlook as volatility and direction remain muted
For the next five trading days, the expected price range is $5.15 to $5.59, narrowly surrounding the current price and respecting typical weekly volatility. The probability of a price increase is moderate at 50%, with a price decrease being no more or less likely. Baseline scenario sees JBLU fluctuating in a sideways corridor around current levels. If bulls push the price above resistance at $5.20, a test of the $5.59 zone is possible. A bearish break below support at $5.13 may trigger a pullback toward $5.00, but significant downside appears limited unless broader negativity emerges.
Last time, analysts noted that JetBlue Airways Corp is exhibiting mild short-term downside pressure as it trades just below its 20-day moving average but remains supported by medium- and long-term moving averages. Technical momentum signals are mixed, with bullish MACD offset by neutral-to-weak oscillators and balanced probabilities favoring a sideways trading range between nearby support and resistance over the coming days.


Latest JetBlue News


-
 Afghanistan
-
 Albania
-
 Algeria
-
 Angola
-
 Argentina
-
 Armenia
-
 Australia
-
 Austria
-
 Azerbaijan
-
 Bahamas
-
 Bahrain
-
 Bangladesh
-
 Belarus
-
 Belgium
-
 Bolivia
-
 Botswana
-
 Brazil
-
 Brunei
-
 Bulgaria
-
 Cambodia
-
 Cameroon
-
 Canada
-
 Chile
Chile
-
 China
China
-
 Colombia
-
 Congo
Congo
-
 Costa Rica
-
 Cote d'Ivoire
-
 Croatia
-
 Cuba
Cuba
-
 Cyprus
-
 Czechia
-
 DR Congo
-
 Denmark
-
 Dominican Republic
-
 Ecuador
-
 Egypt
Egypt
-
 El Salvador
-
 Estonia
-
 Eswatini
-
 Ethiopia
-
 Finland
-
 France
-
 Georgia
-
 Germany
-
 Ghana
Ghana
-
 Greece
-
 Haiti
Haiti
-
 Hong Kong
-
 Hungary
-
 India
India
-
 Indonesia
-
 Iran, Islamic republic
-
 Iraq
Iraq
-
 Ireland
-
 Israel
-
 Italy
Italy
-
 Jamaica
-
 Japan
Japan
-
 Jordan
-
 Kazakhstan
-
 Kenya
Kenya
-
 Korea
Korea
-
 Kuwait
-
 Kyrgyzstan
-
 Laos
Laos
-
 Latvia
-
 Lebanon
-
 Lesotho
-
 Libya
Libya
-
 Lithuania
-
 Luxembourg
-
 Madagascar
-
 Malaysia
-
 Malta
Malta
-
 Mauritius
-
 Mexico
-
 Moldova
-
 Mongolia
-
 Montenegro
-
 Morocco
-
 Mozambique
-
 Myanmar
-
 Namibia
-
 Nepal
Nepal
-
 Netherlands
-
 New Zealand
-
 Nigeria
-
 North Macedonia
-
 Norway
-
 Oman
Oman
-
 Pakistan
-
 Palestine
-
 Panama
-
 Papua New Guinea
-
 Paraguay
-
 Peru
Peru
-
 Philippines
-
 Poland
-
 Portugal
-
 Puerto Rico
-
 Qatar
Qatar
-
 Reunion
-
 Romania
-
 Rwanda
-
 Saudi Arabia
-
 Serbia
-
 Singapore
-
 Slovakia
-
 Slovenia
-
 Somalia
-
 South Africa
-
 Spain
Spain
-
 Sri Lanka
-
 Sweden
-
 Switzerland
-
 Syria
Syria
-
 Taiwan
-
 Tajikistan
-
 Tanzania
-
 Thailand
-
 Trinidad and Tobago
-
 Tunisia
-
 Turkey
-
 UAE
UAE
-
 Uganda
-
 Ukraine
-
 United Kingdom
-
United States
-
 Uruguay
-
 Uzbekistan
-
 Venezuela
-
 Vietnam
-
 Yemen
Yemen
-
 Zambia
-
 Zimbabwe
- Forex
- Crypto
