
Wider quarterly loss and mixed technicals — JetBlue Airways stock slips 3.27%

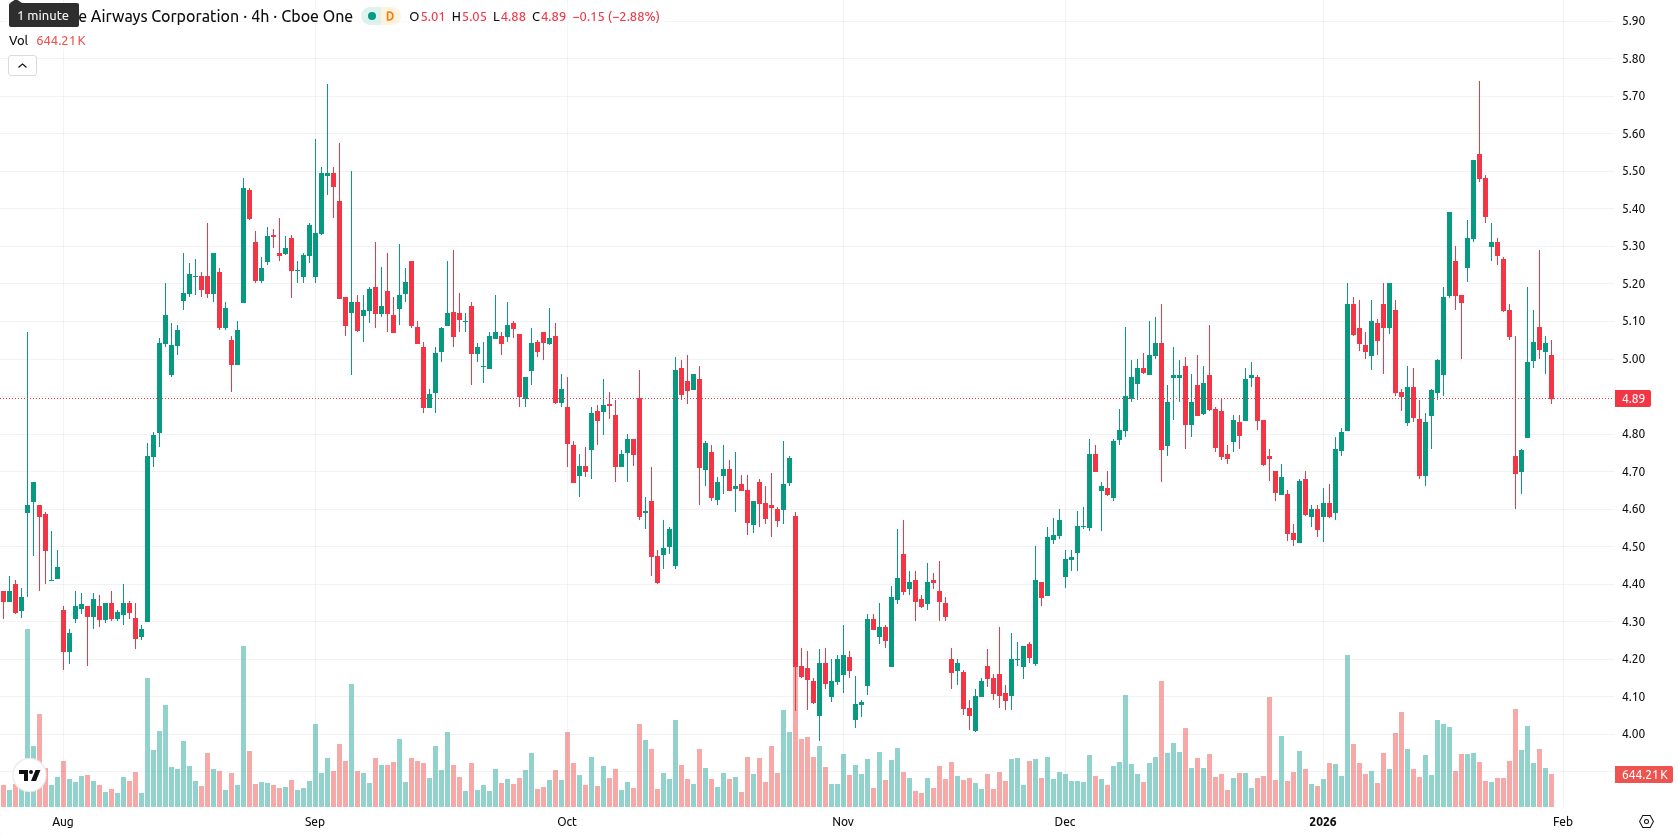
JetBlue Airways Corp (JBLU) is trading at $4.89, just below the MA-20 ($5.02), but above both the MA-50 ($4.78) and MA-200 ($4.68). This setup signals mild short-term downside pressure, while medium- and long-term trends remain supportive thanks to dynamic support at the MA-50 and resistance from the Ichimoku Kijun at $5.13.
Highlights
- JetBlue Airways posted a Q4 2025 loss of $0.49 per share, significantly wider than analyst expectations, driving negative sentiment.
- Revenue beat forecasts due to robust premium travel demand, but operating expenses per available seat mile rose 5.4%, with average fuel prices at $2.51 per gallon.
- JBLU trades at $4.89, below MA-20 ($5.02) yet above MA-50 ($4.78), with next five-day range seen at $4.80–$5.05 and modest short-term downside risk.
Wider loss but revenue beat as premium demand offsets cost gains
JetBlue Airways reported a fourth-quarter 2025 loss of $0.49 per share, which was wider than analyst estimates. Revenue, however, surpassed expectations, supported by strong demand for premium travel. The company saw operating expenses per available seat mile rise by 5.4% year over year and an increase in average fuel price per gallon to $2.51.
Mixed momentum signals as short-term sellers pressure intraday lows
Momentum indicators give a mixed, divergent picture: daily MACD is in Strong Buy territory but the ADX reads as Neutral, pointing to weak directional commitment. Daily RSI is modestly bullish and not overbought or oversold, while the Stochastic RSI and CCI remain neutral, and Bull/Bear Power shows some buyer dominance; however, nearly all fast oscillators on lower timeframes favor sellers, signaling short-term weakness. The Awesome Oscillator is neutral and does not reinforce either path. There was no significant gap at the open ($5.01 vs. prior close $5.05); the stock now trades near the intraday low after slipping 3.27%, reflecting moderate volatility and clear pressure following the open, which confirms the short-term intraday bearish momentum.
Sideways outlook as balanced probabilities limit breakout risk
Looking ahead, the expected trading range for the next five days is $4.80 – $5.05, representing a typical volatility band relative to current levels. The probability of a price increase is moderate at around 50%, while the odds for further decline are equally balanced. The baseline scenario is for JBLU to move sideways within this band. A bullish scenario would require a breakout above $5.05 and the Ichimoku Kijun at $5.13, while a breakdown below $4.80 could lead to increased selling pressure toward medium-term support.
Previously it was reported that JetBlue Airways is trading above its key moving averages and the Ichimoku Kijun, indicating supportive short- to long-term trends despite recent volatility. Technical indicators remain mixed, with a bullish MACD contrasted by a weak ADX and oversold oscillators, suggesting likely consolidation between support at $4.75 and resistance at $5.20 in the near term.


Latest JetBlue News


-
 Afghanistan
-
 Albania
-
 Algeria
-
 Angola
-
 Argentina
-
 Armenia
-
 Australia
-
 Austria
-
 Azerbaijan
-
 Bahamas
-
 Bahrain
-
 Bangladesh
-
 Belarus
-
 Belgium
-
 Bolivia
-
 Botswana
-
 Brazil
-
 Brunei
-
 Bulgaria
-
 Cambodia
-
 Cameroon
-
 Canada
-
 Chile
Chile
-
 China
China
-
 Colombia
-
 Congo
Congo
-
 Costa Rica
-
 Cote d'Ivoire
-
 Croatia
-
 Cuba
Cuba
-
 Cyprus
-
 Czechia
-
 DR Congo
-
 Denmark
-
 Dominican Republic
-
 Ecuador
-
 Egypt
Egypt
-
 El Salvador
-
 Estonia
-
 Eswatini
-
 Ethiopia
-
 Finland
-
 France
-
 Georgia
-
 Germany
-
 Ghana
Ghana
-
 Greece
-
 Haiti
Haiti
-
 Hong Kong
-
 Hungary
-
 India
India
-
 Indonesia
-
 Iran, Islamic republic
-
 Iraq
Iraq
-
 Ireland
-
 Israel
-
 Italy
Italy
-
 Jamaica
-
 Japan
Japan
-
 Jordan
-
 Kazakhstan
-
 Kenya
Kenya
-
 Korea
Korea
-
 Kuwait
-
 Kyrgyzstan
-
 Laos
Laos
-
 Latvia
-
 Lebanon
-
 Lesotho
-
 Libya
Libya
-
 Lithuania
-
 Luxembourg
-
 Madagascar
-
 Malaysia
-
 Malta
Malta
-
 Mauritius
-
 Mexico
-
 Moldova
-
 Mongolia
-
 Montenegro
-
 Morocco
-
 Mozambique
-
 Myanmar
-
 Namibia
-
 Nepal
Nepal
-
 Netherlands
-
 New Zealand
-
 Nigeria
-
 North Macedonia
-
 Norway
-
 Oman
Oman
-
 Pakistan
-
 Palestine
-
 Panama
-
 Papua New Guinea
-
 Paraguay
-
 Peru
Peru
-
 Philippines
-
 Poland
-
 Portugal
-
 Puerto Rico
-
 Qatar
Qatar
-
 Reunion
-
 Romania
-
 Rwanda
-
 Saudi Arabia
-
 Serbia
-
 Singapore
-
 Slovakia
-
 Slovenia
-
 Somalia
-
 South Africa
-
 Spain
Spain
-
 Sri Lanka
-
 Sweden
-
 Switzerland
-
 Syria
Syria
-
 Taiwan
-
 Tajikistan
-
 Tanzania
-
 Thailand
-
 Trinidad and Tobago
-
 Tunisia
-
 Turkey
-
 UAE
UAE
-
 Uganda
-
 Ukraine
-
 United Kingdom
-
United States
-
 Uruguay
-
 Uzbekistan
-
 Venezuela
-
 Vietnam
-
 Yemen
Yemen
-
 Zambia
-
 Zimbabwe
- Forex
- Crypto
