
JetBlue Airways stock price forecast: Consolidation expected as JBLU gains 8.53% on strong session

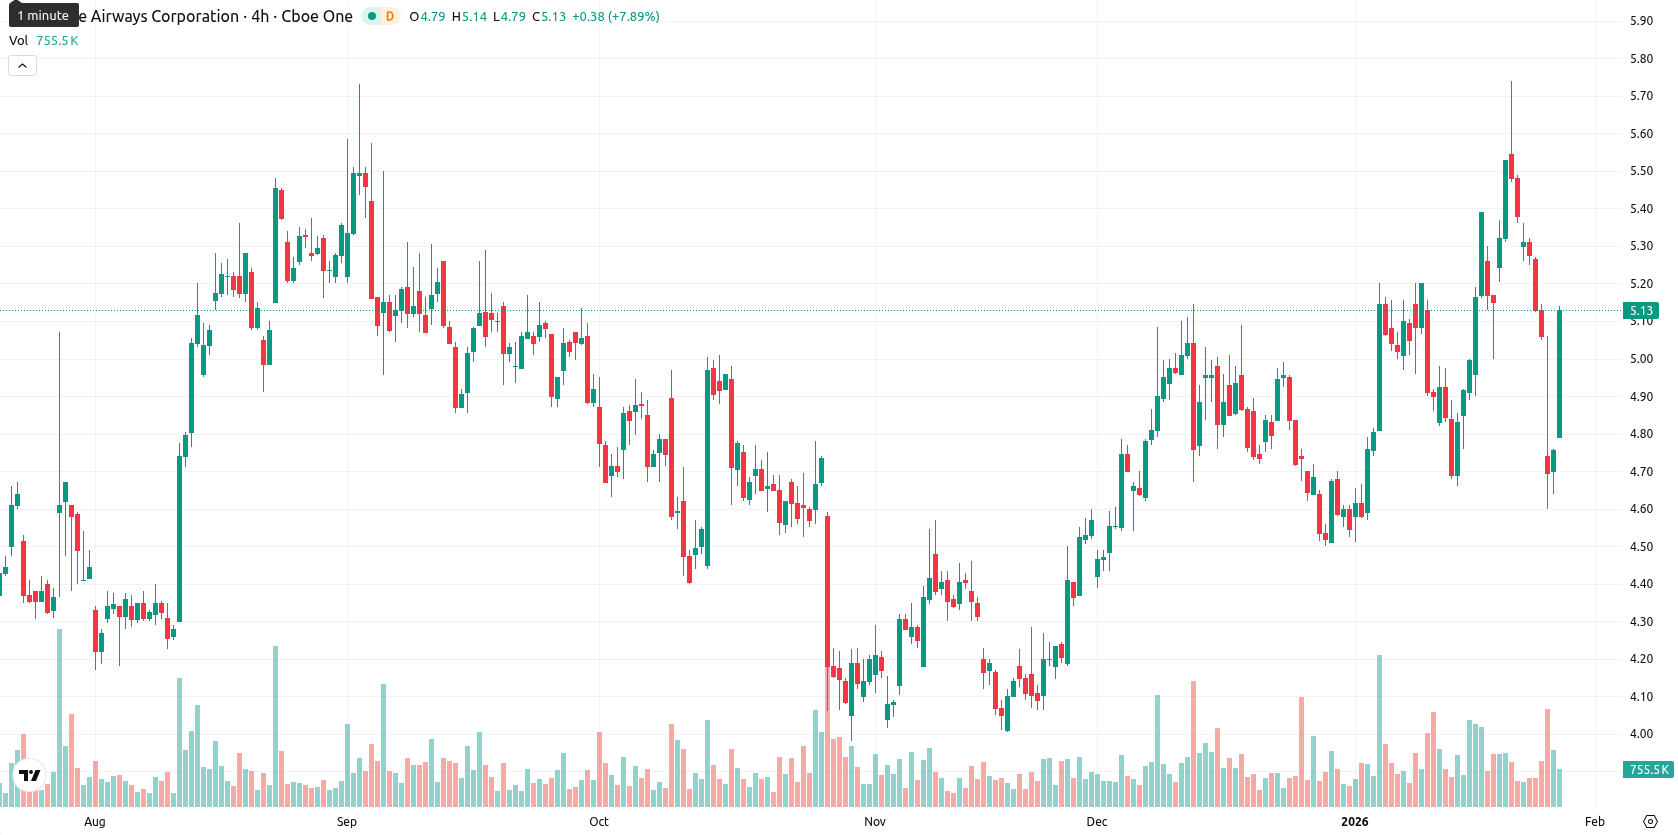
JetBlue Airways Corp (JBLU) is currently trading at $5.13, posting an 8.53% daily gain. The asset stands above its MA-20 ($4.97), MA-50 ($4.75), and MA-200 ($4.66), signaling a supportive short-term to long-term trend, and is also above the Ichimoku Kijun at $5.13.
Highlights
- JBLU is trading at $5.13, above the MA-20 ($4.97), MA-50 ($4.75), and MA-200 ($4.66), signaling a short- and medium-term bullish technical setup.
- Momentum signals are mixed: MACD shows a strong buy, but RSI is below 50 (sell), ADX is neutral, and Stochastic RSI is oversold on D1.
- JBLU’s next five-day range is projected at $4.60–$5.50, with $5.20 as key resistance and $4.75 and $4.60 as important short-term supports.
Operational improvement offsets earnings miss amid macro headwinds
JetBlue Airways reported a net loss of $0.49 per share for the fourth quarter of 2025 and quarterly revenue of $2.24 billion, missing consensus estimates. Despite financial headwinds, operational performance improved, surpassing on-time targets for a second year and achieving higher customer satisfaction. The company credited its JetForward transformation plan for delivering $305 million in added EBIT, while also noting challenges such as macroeconomic uncertainty, a government shutdown, an Airbus directive, and elevated fuel prices.
Mixed buy and oversold signals as momentum weakens
Momentum signals for JBLU are mixed — the MACD gives a strong buy, but the ADX is neutral, signaling little directional conviction. The RSI is below 50 and points to sell, Stochastic RSI signals oversold conditions, and the CCI remains negative, indicating persistent downside pressure. Bull/Bear Power is slightly negative but nearly neutral, while the Awesome Oscillator is also neutral, offering no support for the current trend. Price action began with a small gap up from $4.73 to $4.80, and volatility is elevated with momentum toward session highs.
Consolidation likely as breakout potential battles downside risk
For the next five trading days, the typical volatility band is expected between $4.60 and $5.50. The probability of further price increases this week is low (under 20%), and further declines or sideways consolidation are more likely. The baseline scenario is consolidation between support at $4.75 and resistance at $5.20, with a bullish breakout above $5.20 opening upside to $5.50, or a break below $4.75 exposing downside risk to $4.60.
Most recently, JetBlue Airways Corporation traded above its short- medium- and long-term moving averages, signaling ongoing upside momentum and resilience over key support. Despite an earnings miss and cost pressures from operational disruptions, technical indicators remain mixed with bullish MACD, weak ADX, and oscillators suggesting both sell conditions and oversold signals, reflecting elevated volatility and uncertainty around the current direction.


Latest JetBlue News


-
 Afghanistan
-
 Albania
-
 Algeria
-
 Angola
-
 Argentina
-
 Armenia
-
 Australia
-
 Austria
-
 Azerbaijan
-
 Bahamas
-
 Bahrain
-
 Bangladesh
-
 Belarus
-
 Belgium
-
 Bolivia
-
 Botswana
-
 Brazil
-
 Brunei
-
 Bulgaria
-
 Cambodia
-
 Cameroon
-
 Canada
-
 Chile
Chile
-
 China
China
-
 Colombia
-
 Congo
Congo
-
 Costa Rica
-
 Cote d'Ivoire
-
 Croatia
-
 Cuba
Cuba
-
 Cyprus
-
 Czechia
-
 DR Congo
-
 Denmark
-
 Dominican Republic
-
 Ecuador
-
 Egypt
Egypt
-
 El Salvador
-
 Estonia
-
 Eswatini
-
 Ethiopia
-
 Finland
-
 France
-
 Georgia
-
 Germany
-
 Ghana
Ghana
-
 Greece
-
 Haiti
Haiti
-
 Hong Kong
-
 Hungary
-
 India
India
-
 Indonesia
-
 Iran, Islamic republic
-
 Iraq
Iraq
-
 Ireland
-
 Israel
-
 Italy
Italy
-
 Jamaica
-
 Japan
Japan
-
 Jordan
-
 Kazakhstan
-
 Kenya
Kenya
-
 Korea
Korea
-
 Kuwait
-
 Kyrgyzstan
-
 Laos
Laos
-
 Latvia
-
 Lebanon
-
 Lesotho
-
 Libya
Libya
-
 Lithuania
-
 Luxembourg
-
 Madagascar
-
 Malaysia
-
 Malta
Malta
-
 Mauritius
-
 Mexico
-
 Moldova
-
 Mongolia
-
 Montenegro
-
 Morocco
-
 Mozambique
-
 Myanmar
-
 Namibia
-
 Nepal
Nepal
-
 Netherlands
-
 New Zealand
-
 Nigeria
-
 North Macedonia
-
 Norway
-
 Oman
Oman
-
 Pakistan
-
 Palestine
-
 Panama
-
 Papua New Guinea
-
 Paraguay
-
 Peru
Peru
-
 Philippines
-
 Poland
-
 Portugal
-
 Puerto Rico
-
 Qatar
Qatar
-
 Reunion
-
 Romania
-
 Rwanda
-
 Saudi Arabia
-
 Serbia
-
 Singapore
-
 Slovakia
-
 Slovenia
-
 Somalia
-
 South Africa
-
 Spain
Spain
-
 Sri Lanka
-
 Sweden
-
 Switzerland
-
 Syria
Syria
-
 Taiwan
-
 Tajikistan
-
 Tanzania
-
 Thailand
-
 Trinidad and Tobago
-
 Tunisia
-
 Turkey
-
 UAE
UAE
-
 Uganda
-
 Ukraine
-
 United Kingdom
-
United States
-
 Uruguay
-
 Uzbekistan
-
 Venezuela
-
 Vietnam
-
 Yemen
Yemen
-
 Zambia
-
 Zimbabwe
- Forex
- Crypto
