
Palantir stock: Strong Q4 revenue growth and AI adoption drive 7.39% daily gain

Palantir Technologies Inc (PLTR) is trading at $158.69, currently below its 20-day ($169.03) and 50-day ($174.44) Moving Averages, and just under the 200-day level at $159.17. This setup points to ongoing short- and medium-term bearish pressure, with the price also below the Ichimoku Kijun at $170.74, which now acts as dynamic resistance.
PLTR price prediction
Current price:
$ 131.43
1.22
0.94%
Closed
06/11
Daily range
127.75
 131.61
Weekly range
127.35
141.65
Loading...
Highlights
- Palantir posted Q4 2025 earnings surpassing expectations, with total revenue up 70% driven by robust AI tool adoption among U.S. government and commercial clients.
- U.S. commercial revenue surged 137% to $507 million and U.S. government revenue climbed 66% to $570 million, with positive FY 2026 guidance and a new Nvidia partnership.
- PLTR trades at $158.69, below key 20-, 50-, and 200-day moving averages, with technicals indicating short- to medium-term bearish pressure and a $150–$165 consolidation range ahead.
Robust earnings and AI demand drive upbeat revenue forecasts
Palantir reported fourth-quarter 2025 earnings that beat Wall Street expectations, driven by strong adoption of its artificial intelligence tools among U.S. government and commercial clients. The company registered a 70% year-over-year revenue increase for Q4 2025, with U.S. commercial revenue rising 137% to $507 million and U.S. government revenue growing 66% to $570 million. Palantir also provided positive guidance for fiscal year 2026, forecasting 61% revenue growth and highlighting continued partnership expansion, including a recent collaboration with Nvidia.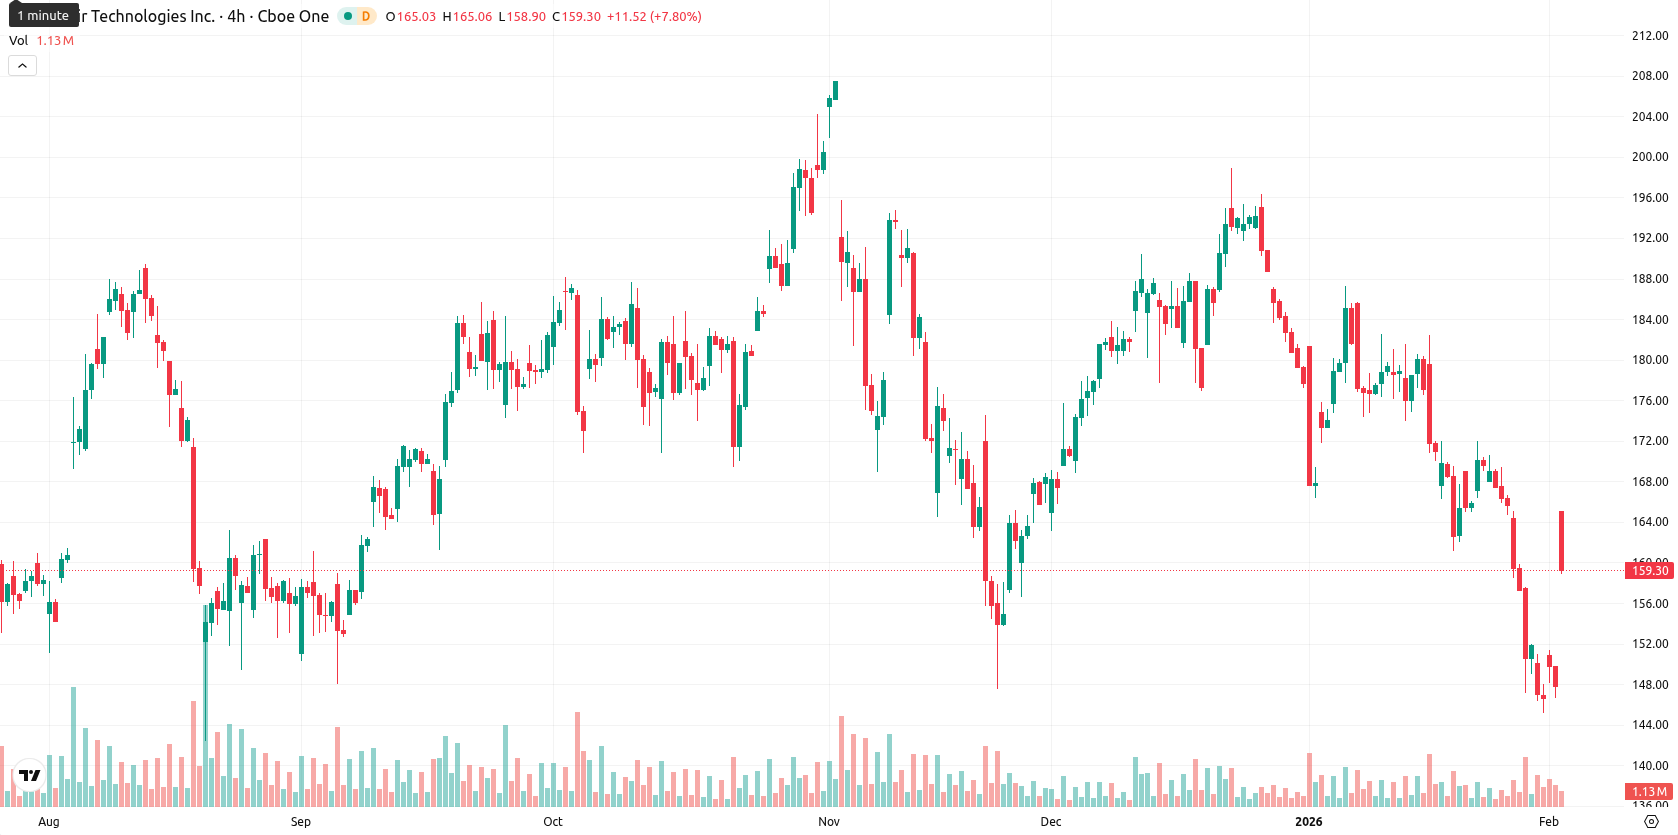
Momentum-oscillator divergence as oversold signals clash with selling pressure
Momentum signals for PLTR are mixed: the daily MACD forecasts further downside, and the ADX indicates weak trend strength with a neutral stance. Multiple oscillators, including an RSI of 27.18, deep oversold Stochastic RSI, and a CCI of –170.37, reflect short-term oversold conditions, yet the Bull/Bear Power at –10.71 confirms sellers remain in control. A wide trading gap up from $147.77 to $162.71 initiated the session, but the stock is now trading mid-range with high volatility and signs of post-gap selling pressure, despite a 7.39% daily gain — revealing a notable divergence between momentum and oscillator signals.Rangebound trade likely as bullish catalysts remain out of reach
Over the next five trading days, PLTR is likely to range between $150.00 and $165.00, reflecting a typical volatility band relative to current levels. There is less than a 20% chance of a sustained upside move, with a decline more likely in the short term. The baseline outlook suggests PLTR will consolidate sideways between $150.00 and $165.00. A bullish breakout would require a daily close above the Ichimoku Kijun and the 50-day Moving Average to target $170.00, while a drop below $150.00 could open the way to further losses toward $147.00–$145.00.
Viktoras Karapetjanc, expert at Traders Union, sees Palantir’s strong earnings and explosive revenue growth as a fundamental support for the stock, even as short-term technicals remain heavy. He believes robust AI-driven demand and key partnerships with government and commercial clients create solid macro tailwinds. The analyst notes that while current momentum is weak, rapid adoption and upbeat guidance signal improving long-term sentiment. 'If Palantir stabilizes above $159.17 and buyers return, I expect any breakout to have staying power backed by their positive AI growth story.'
Previously it was reported that Palantir Technologies Inc. remains under persistent downside pressure, trading below all major moving averages with sellers controlling the trend and limited upside potential ahead of earnings despite recent contract wins. Technical indicators such as a low RSI, negative MACD, and weak ADX reinforce the prevailing bearish momentum, with immediate resistance near $170.74 and dynamic support around the MA-200, as the price stalls within a narrow range and downside risk remains elevated.
Source of Data:
PLTR Price Analysis by TU
The analysis is based on a proprietary model combining technical, on-chain, and expert data. Not investment advice. See
methodology
The information is based on forecasts and does not constitute investment advice or a guarantee of future results. Market conditions may change. See our Disclaimer and Editorial Integrity for details.
Subscribe to TU news
Did you like the article?


Weekly Top Bonuses

Top News


Top 5 companies for you

United States
-
 Afghanistan
-
 Albania
-
 Algeria
-
 Angola
-
 Argentina
-
 Armenia
-
 Australia
-
 Austria
-
 Azerbaijan
-
 Bahamas
-
 Bahrain
-
 Bangladesh
-
 Belarus
-
 Belgium
-
 Bolivia
-
 Botswana
-
 Brazil
-
 Brunei
-
 Bulgaria
-
 Cambodia
-
 Cameroon
-
 Canada
-
 Chile
Chile
-
 China
China
-
 Colombia
-
 Congo
Congo
-
 Costa Rica
-
 Cote d'Ivoire
-
 Croatia
-
 Cuba
Cuba
-
 Cyprus
-
 Czechia
-
 DR Congo
-
 Denmark
-
 Dominican Republic
-
 Ecuador
-
 Egypt
Egypt
-
 El Salvador
-
 Estonia
-
 Eswatini
-
 Ethiopia
-
 Finland
-
 France
-
 Georgia
-
 Germany
-
 Ghana
Ghana
-
 Greece
-
 Haiti
Haiti
-
 Hong Kong
-
 Hungary
-
 India
India
-
 Indonesia
-
 Iran, Islamic republic
-
 Iraq
Iraq
-
 Ireland
-
 Israel
-
 Italy
Italy
-
 Jamaica
-
 Japan
Japan
-
 Jordan
-
 Kazakhstan
-
 Kenya
Kenya
-
 Korea
Korea
-
 Kuwait
-
 Kyrgyzstan
-
 Laos
Laos
-
 Latvia
-
 Lebanon
-
 Lesotho
-
 Libya
Libya
-
 Lithuania
-
 Luxembourg
-
 Madagascar
-
 Malaysia
-
 Malta
Malta
-
 Mauritius
-
 Mexico
-
 Moldova
-
 Mongolia
-
 Montenegro
-
 Morocco
-
 Mozambique
-
 Myanmar
-
 Namibia
-
 Nepal
Nepal
-
 Netherlands
-
 New Zealand
-
 Nigeria
-
 North Macedonia
-
 Norway
-
 Oman
Oman
-
 Pakistan
-
 Palestine
-
 Panama
-
 Papua New Guinea
-
 Paraguay
-
 Peru
Peru
-
 Philippines
-
 Poland
-
 Portugal
-
 Puerto Rico
-
 Qatar
Qatar
-
 Reunion
-
 Romania
-
 Rwanda
-
 Saudi Arabia
-
 Serbia
-
 Singapore
-
 Slovakia
-
 Slovenia
-
 Somalia
-
 South Africa
-
 Spain
Spain
-
 Sri Lanka
-
 Sweden
-
 Switzerland
-
 Syria
Syria
-
 Taiwan
-
 Tajikistan
-
 Tanzania
-
 Thailand
-
 Trinidad and Tobago
-
 Tunisia
-
 Turkey
-
 UAE
UAE
-
 Uganda
-
 Ukraine
-
 United Kingdom
-
United States
-
 Uruguay
-
 Uzbekistan
-
 Venezuela
-
 Vietnam
-
 Yemen
Yemen
-
 Zambia
-
 Zimbabwe
- Forex
- Crypto
