
AAPL weekly outlook: price trades above MA-20, MA-50, and MA-200 — trend strength persists

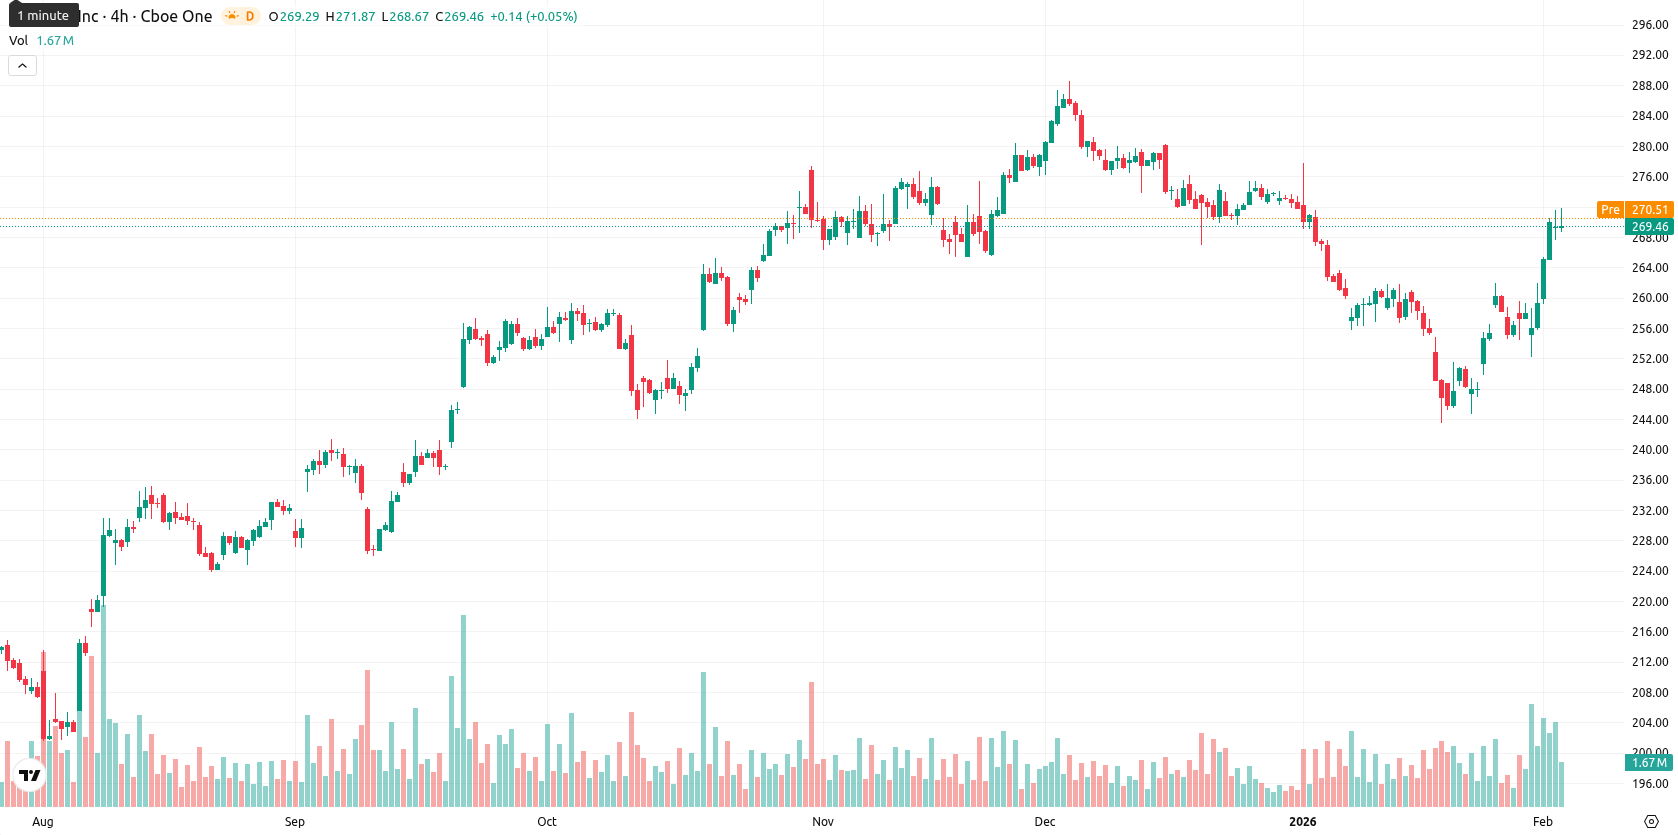
Apple Inc. (AAPL) closed the week at $269.55, reflecting a minimal weekly move of -$0.46, or -0.17%. The price remains firmly above the MA-20 ($257.72), MA-50 ($268.36), and MA-200 ($237.36) on the weekly timeframe, confirming a persistent bullish momentum with the asset trading above all key moving averages.
Highlights
- Apple trades at $269.55, above the MA-20 ($257.72), MA-50 ($268.36), and MA-200 ($237.36), confirming a sustained bullish technical structure across timeframes.
- Oscillators including RSI (61.63), CCI (188.02), and Stochastic RSI indicate overbought conditions, while MACD issues a strong daily sell signal amid uncertain intraday direction.
- Expected 5-day range is $265.00–$275.00, with bullish momentum likely if price breaks above $271–$273 resistance, but a move under $260 Ichimoku Kijun could trigger a deeper pullback.
Earnings beats and buybacks boost weekly sentiment after record revenues
Apple reported fiscal Q1 2026 revenue of $143.8 billion and earnings per share of $2.84, both surpassing expectations. The company announced a dividend increase to $0.26 per share and completed $25 billion in share buybacks while distributing $3.9 billion in dividends. Additionally, Apple saw record-high performance in its iPhone and Services segments and benefited from the recent launch of OpenAI's Codex app for macOS.
Overbought signals emerge as momentum and resistance cluster during week
On the weekly chart, AAPL is trading above its MA-20, MA-50, and MA-200, illustrating continued strength in the short-, medium-, and long-term trends. The Ichimoku Kijun at $260.60 serves as dynamic support, while immediate resistance aligns with the MA-50 ($268.36) and round level at $270. Weekly oscillators show the RSI-W1 at 61.63 and CCI at 188.02, both indicating overbought conditions, further supported by the Stochastic RSI also in the overbought zone. MACD-W1 remains positive, with the ADX at 20.14 signaling a developing but not yet strong trend, and the Awesome Oscillator staying neutral.
Consolidation likely as technical strength supports upside bias next week
Over the next 5–7 trading days, AAPL is expected to consolidate within the $265.00 to $275.00 range, supported by its position above major moving averages and a high probability of further gains as indicated by three Buy or Strong Buy weekly indicators. A sustained move above the $271–$273 zone could open the path toward new highs. In contrast, a break below Ichimoku Kijun support near $260 would indicate potential for a deeper pullback, though such a scenario is considered low probability given current trend strength.
Last time, analysts noted that Apple Inc. maintained a bullish short-term structure, trading just above its 20-day moving average and finding support near $260, while facing immediate resistance at the 50-day moving average amid intact long-term momentum. Current technical signals are mixed, with overbought conditions and diverging momentum indicators suggesting likely sideways consolidation between $260 and $272, but near-term breakout risks remain as buyer demand persists.


-
 Afghanistan
-
 Albania
-
 Algeria
-
 Angola
-
 Argentina
-
 Armenia
-
 Australia
-
 Austria
-
 Azerbaijan
-
 Bahamas
-
 Bahrain
-
 Bangladesh
-
 Belarus
-
 Belgium
-
 Bolivia
-
 Botswana
-
 Brazil
-
 Brunei
-
 Bulgaria
-
 Cambodia
-
 Cameroon
-
 Canada
-
 Chile
Chile
-
 China
China
-
 Colombia
-
 Congo
Congo
-
 Costa Rica
-
 Cote d'Ivoire
-
 Croatia
-
 Cuba
Cuba
-
 Cyprus
-
 Czechia
-
 DR Congo
-
 Denmark
-
 Dominican Republic
-
 Ecuador
-
 Egypt
Egypt
-
 El Salvador
-
 Estonia
-
 Eswatini
-
 Ethiopia
-
 Finland
-
 France
-
 Georgia
-
 Germany
-
 Ghana
Ghana
-
 Greece
-
 Haiti
Haiti
-
 Hong Kong
-
 Hungary
-
 India
India
-
 Indonesia
-
 Iran, Islamic republic
-
 Iraq
Iraq
-
 Ireland
-
 Israel
-
 Italy
Italy
-
 Jamaica
-
 Japan
Japan
-
 Jordan
-
 Kazakhstan
-
 Kenya
Kenya
-
 Korea
Korea
-
 Kuwait
-
 Kyrgyzstan
-
 Laos
Laos
-
 Latvia
-
 Lebanon
-
 Lesotho
-
 Libya
Libya
-
 Lithuania
-
 Luxembourg
-
 Madagascar
-
 Malaysia
-
 Malta
Malta
-
 Mauritius
-
 Mexico
-
 Moldova
-
 Mongolia
-
 Montenegro
-
 Morocco
-
 Mozambique
-
 Myanmar
-
 Namibia
-
 Nepal
Nepal
-
 Netherlands
-
 New Zealand
-
 Nigeria
-
 North Macedonia
-
 Norway
-
 Oman
Oman
-
 Pakistan
-
 Palestine
-
 Panama
-
 Papua New Guinea
-
 Paraguay
-
 Peru
Peru
-
 Philippines
-
 Poland
-
 Portugal
-
 Puerto Rico
-
 Qatar
Qatar
-
 Reunion
-
 Romania
-
 Rwanda
-
 Saudi Arabia
-
 Serbia
-
 Singapore
-
 Slovakia
-
 Slovenia
-
 Somalia
-
 South Africa
-
 Spain
Spain
-
 Sri Lanka
-
 Sweden
-
 Switzerland
-
 Syria
Syria
-
 Taiwan
-
 Tajikistan
-
 Tanzania
-
 Thailand
-
 Trinidad and Tobago
-
 Tunisia
-
 Turkey
-
 UAE
UAE
-
 Uganda
-
 Ukraine
-
 United Kingdom
-
United States
-
 Uruguay
-
 Uzbekistan
-
 Venezuela
-
 Vietnam
-
 Yemen
Yemen
-
 Zambia
-
 Zimbabwe
- Forex
- Crypto
