
Sundial Growers stock price forecast: Downside risk prevails as SNDL tests support zone

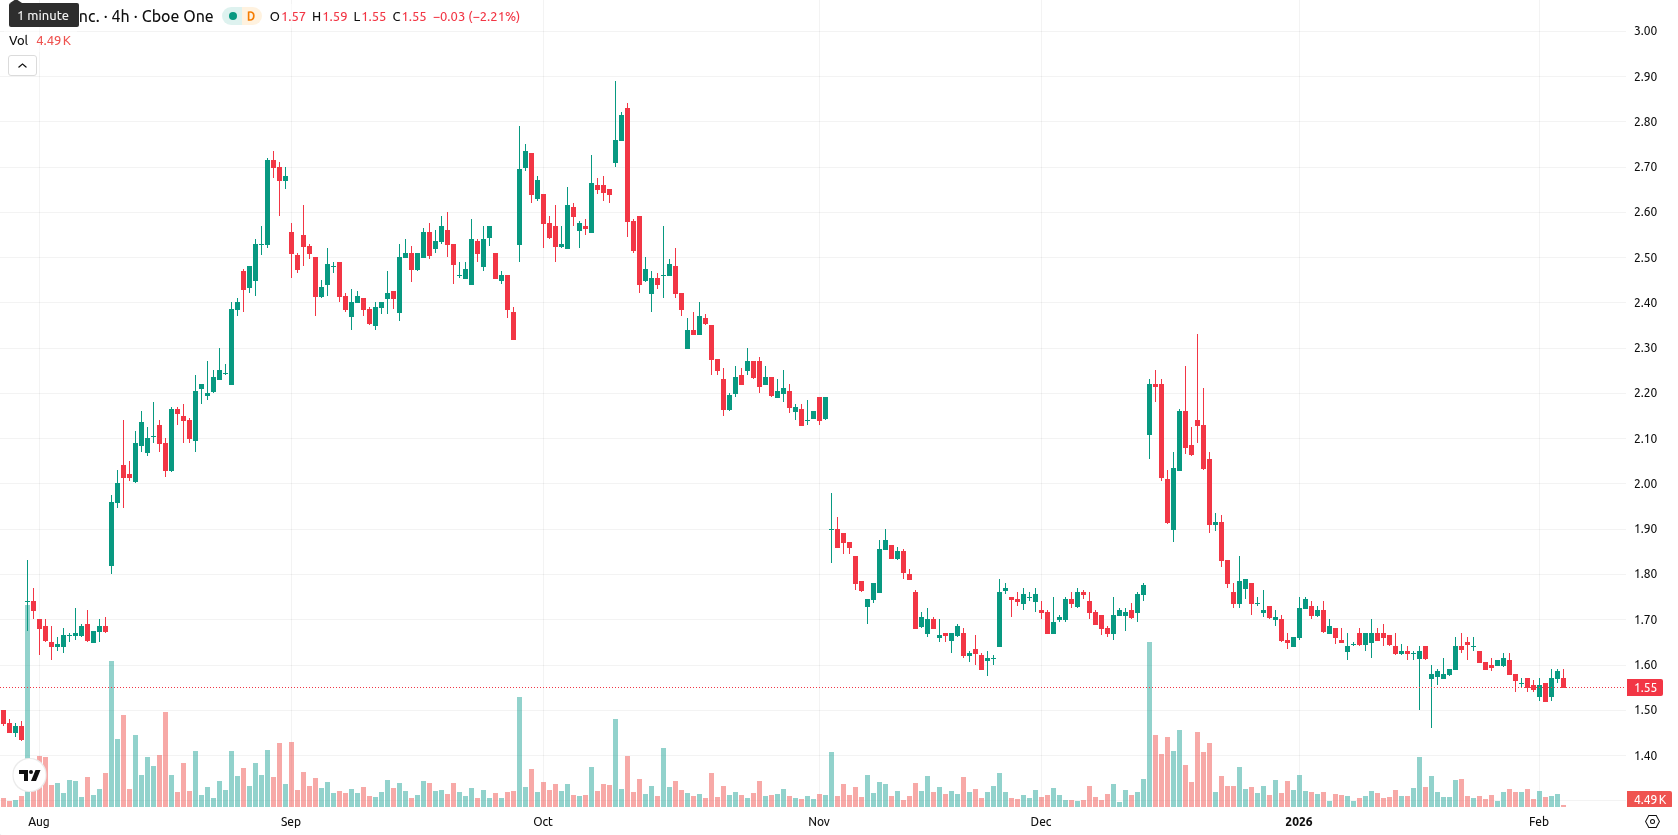
Sundial Growers Inc. (SNDL) is trading at $1.54, which is below the MA-20 at $1.61, MA-50 at $1.72, and MA-200 at $1.79. This positioning highlights ongoing short-, medium-, and long-term pressure from sellers, while the nearest dynamic resistance is the Ichimoku Kijun at $1.61 and support is likely just below the current price.
Highlights
- SNDL trades at $1.54, positioned below its MA-20 ($1.61), MA-50 ($1.72), and MA-200 ($1.79), indicating sustained selling pressure across all time frames.
- Momentum and demand remain weak, as shown by a negative MACD, RSI at 43.88, CCI at –84.07, and seller-favored Bull/Bear Power, despite mixed oscillator signals.
- The expected five-day range is $1.51–$1.60, with a breakdown below $1.51 increasing downside risk, while resistance is near the Ichimoku Kijun at $1.61.
Bearish momentum dominates as indicators flash mixed market signals
Momentum remains weak as indicated by a negative MACD and a Neutral ADX reading, suggesting the trend lacks strength. The Relative Strength Index and Commodity Channel Index both signal a lack of demand (RSI at 43.88, CCI at –84.07), while the Stochastic RSI is in Overbought territory, pointing to mixed conditions. Bull/Bear Power favors sellers, reinforcing the current downside move; the daily price slipped 3.14% without a notable opening gap. The price is currently near the session low, intraday volatility is modest, and there is continued pressure after the open — however, divergences between oscillators and momentum indicators hint at an unsettled backdrop.
Further downside risk expected as rebound likelihood remains low
For the next five trading days, the expected range is $1.51 — $1.60. The probability of a price increase is very low (less than 20%), making a further decrease substantially more likely. The baseline scenario is a sideways consolidation just above recent lows. A bullish scenario suggests a move above $1.61 with confirmation needed from renewed momentum, while a bearish outcome involves a breakdown below the $1.51 support area that could accelerate declines.
Last time, analysts noted that Sundial Growers Inc. is trading below all key moving averages, with the price facing resistance at the Ichimoku Kijun and forming support slightly below current levels. Momentum indicators such as the MACD and ADX signal sustained weakness, while oscillators like the RSI and Stochastic RSI show oversold conditions, suggesting ongoing bearish pressure despite mild intraday buying strength.


-
 Afghanistan
-
 Albania
-
 Algeria
-
 Angola
-
 Argentina
-
 Armenia
-
 Australia
-
 Austria
-
 Azerbaijan
-
 Bahamas
-
 Bahrain
-
 Bangladesh
-
 Belarus
-
 Belgium
-
 Bolivia
-
 Botswana
-
 Brazil
-
 Brunei
-
 Bulgaria
-
 Cambodia
-
 Cameroon
-
 Canada
-
 Chile
Chile
-
 China
China
-
 Colombia
-
 Congo
Congo
-
 Costa Rica
-
 Cote d'Ivoire
-
 Croatia
-
 Cuba
Cuba
-
 Cyprus
-
 Czechia
-
 DR Congo
-
 Denmark
-
 Dominican Republic
-
 Ecuador
-
 Egypt
Egypt
-
 El Salvador
-
 Estonia
-
 Eswatini
-
 Ethiopia
-
 Finland
-
 France
-
 Georgia
-
 Germany
-
 Ghana
Ghana
-
 Greece
-
 Haiti
Haiti
-
 Hong Kong
-
 Hungary
-
 India
India
-
 Indonesia
-
 Iran, Islamic republic
-
 Iraq
Iraq
-
 Ireland
-
 Israel
-
 Italy
Italy
-
 Jamaica
-
 Japan
Japan
-
 Jordan
-
 Kazakhstan
-
 Kenya
Kenya
-
 Korea
Korea
-
 Kuwait
-
 Kyrgyzstan
-
 Laos
Laos
-
 Latvia
-
 Lebanon
-
 Lesotho
-
 Libya
Libya
-
 Lithuania
-
 Luxembourg
-
 Madagascar
-
 Malaysia
-
 Malta
Malta
-
 Mauritius
-
 Mexico
-
 Moldova
-
 Mongolia
-
 Montenegro
-
 Morocco
-
 Mozambique
-
 Myanmar
-
 Namibia
-
 Nepal
Nepal
-
 Netherlands
-
 New Zealand
-
 Nigeria
-
 North Macedonia
-
 Norway
-
 Oman
Oman
-
 Pakistan
-
 Palestine
-
 Panama
-
 Papua New Guinea
-
 Paraguay
-
 Peru
Peru
-
 Philippines
-
 Poland
-
 Portugal
-
 Puerto Rico
-
 Qatar
Qatar
-
 Reunion
-
 Romania
-
 Rwanda
-
 Saudi Arabia
-
 Serbia
-
 Singapore
-
 Slovakia
-
 Slovenia
-
 Somalia
-
 South Africa
-
 Spain
Spain
-
 Sri Lanka
-
 Sweden
-
 Switzerland
-
 Syria
Syria
-
 Taiwan
-
 Tajikistan
-
 Tanzania
-
 Thailand
-
 Trinidad and Tobago
-
 Tunisia
-
 Turkey
-
 UAE
UAE
-
 Uganda
-
 Ukraine
-
 United Kingdom
-
United States
-
 Uruguay
-
 Uzbekistan
-
 Venezuela
-
 Vietnam
-
 Yemen
Yemen
-
 Zambia
-
 Zimbabwe
- Forex
- Crypto
