
Sundial Growers stock rises 3.29% as bounce occurs despite bearish momentum

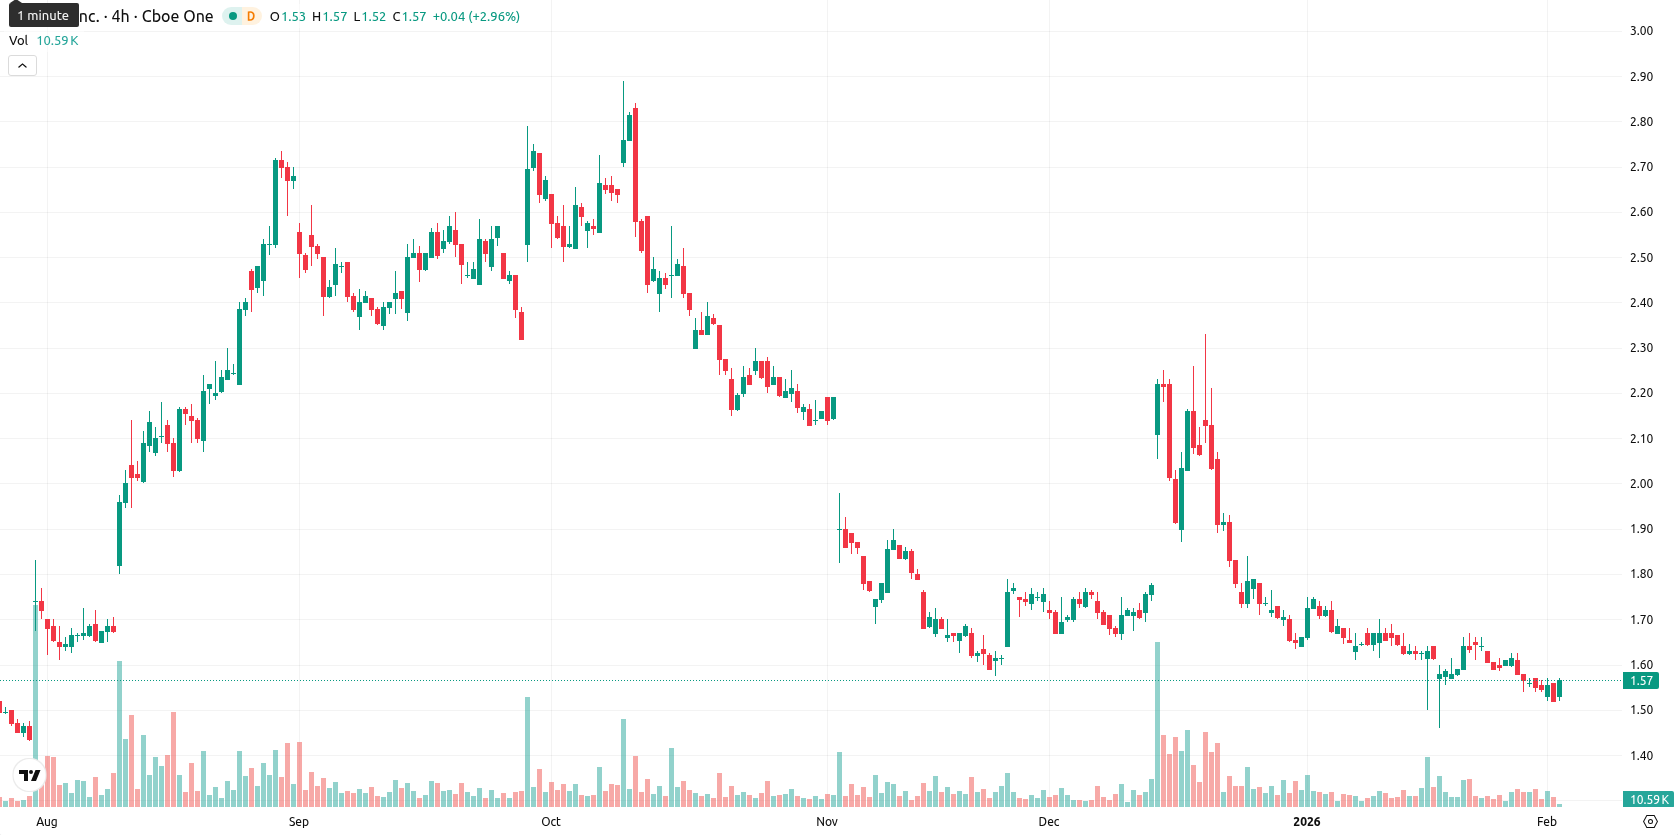
Sundial Growers Inc. (SNDL) is trading at $1.57, which is below the 20-day ($1.62), 50-day ($1.72), and 200-day ($1.79) Moving Averages, signaling ongoing selling pressure across short-, medium-, and long-term timeframes.
Highlights
- SNDL closed at $1.57, trading below its 20-day ($1.62), 50-day ($1.72), and 200-day ($1.79) Moving Averages, indicating persistent selling pressure.
- Oscillators such as RSI, CCI, and Stochastic RSI suggest SNDL is in oversold territory, while the MACD remains in a sell zone, reflecting conflicting momentum signals.
- Key technical levels are resistance at $1.62 (Ichimoku Kijun) and support at $1.52–$1.53, with a 5-day expected range of $1.50 to $1.72 and bearish bias prevailing.
Oversold signals clash with negative momentum near resistance
The nearest dynamic resistance is the Ichimoku Kijun at $1.62, while short-term support is likely to form near the $1.52–$1.53 area. Momentum signals are mixed on the daily chart, with the MACD in a sell zone and the ADX showing weak trend strength. RSI and Commodity Channel Index both indicate oversold conditions, while the Stochastic RSI also points to an oversold environment. Bull/Bear Power suggests a slight advantage to sellers intraday, although today’s session has seen a 3.29% rise with no gap between the previous close and the open. The current price is at the upper end of today’s range, suggesting moderate intraday volatility and some buying strength after the open. Despite the intraday push higher, conflicting signals between oversold oscillators and negative momentum indicators point to a possible divergence that traders should watch closely.
Downside risk dominates as bearish outlook limits rebound
For the next five trading days, the expected price range is $1.50 to $1.72. The probability of a price increase is very low (less than 20%), while the likelihood of a decline is correspondingly higher, aligning with the prevailing bearish technical signals. The baseline scenario assumes consolidation between $1.52 and $1.62. A bullish move could see the price push above the Ichimoku Kijun resistance, opening a path to $1.72. Conversely, a bearish break below $1.52 would expose the stock to further downside toward $1.50.
Previously it was reported that Sundial Growers Inc. continues to trade below major moving averages with momentum indicators signaling persistent weakness, as the price remains under bearish pressure across short, medium, and long-term trends. Technical signals point to mild intraday volatility with immediate support near current levels and resistance at the Ichimoku Kijun, while weekly indicators favor continued downside consolidation within a narrow range.


-
 Afghanistan
-
 Albania
-
 Algeria
-
 Angola
-
 Argentina
-
 Armenia
-
 Australia
-
 Austria
-
 Azerbaijan
-
 Bahamas
-
 Bahrain
-
 Bangladesh
-
 Belarus
-
 Belgium
-
 Bolivia
-
 Botswana
-
 Brazil
-
 Brunei
-
 Bulgaria
-
 Cambodia
-
 Cameroon
-
 Canada
-
 Chile
Chile
-
 China
China
-
 Colombia
-
 Congo
Congo
-
 Costa Rica
-
 Cote d'Ivoire
-
 Croatia
-
 Cuba
Cuba
-
 Cyprus
-
 Czechia
-
 DR Congo
-
 Denmark
-
 Dominican Republic
-
 Ecuador
-
 Egypt
Egypt
-
 El Salvador
-
 Estonia
-
 Eswatini
-
 Ethiopia
-
 Finland
-
 France
-
 Georgia
-
 Germany
-
 Ghana
Ghana
-
 Greece
-
 Haiti
Haiti
-
 Hong Kong
-
 Hungary
-
 India
India
-
 Indonesia
-
 Iran, Islamic republic
-
 Iraq
Iraq
-
 Ireland
-
 Israel
-
 Italy
Italy
-
 Jamaica
-
 Japan
Japan
-
 Jordan
-
 Kazakhstan
-
 Kenya
Kenya
-
 Korea
Korea
-
 Kuwait
-
 Kyrgyzstan
-
 Laos
Laos
-
 Latvia
-
 Lebanon
-
 Lesotho
-
 Libya
Libya
-
 Lithuania
-
 Luxembourg
-
 Madagascar
-
 Malaysia
-
 Malta
Malta
-
 Mauritius
-
 Mexico
-
 Moldova
-
 Mongolia
-
 Montenegro
-
 Morocco
-
 Mozambique
-
 Myanmar
-
 Namibia
-
 Nepal
Nepal
-
 Netherlands
-
 New Zealand
-
 Nigeria
-
 North Macedonia
-
 Norway
-
 Oman
Oman
-
 Pakistan
-
 Palestine
-
 Panama
-
 Papua New Guinea
-
 Paraguay
-
 Peru
Peru
-
 Philippines
-
 Poland
-
 Portugal
-
 Puerto Rico
-
 Qatar
Qatar
-
 Reunion
-
 Romania
-
 Rwanda
-
 Saudi Arabia
-
 Serbia
-
 Singapore
-
 Slovakia
-
 Slovenia
-
 Somalia
-
 South Africa
-
 Spain
Spain
-
 Sri Lanka
-
 Sweden
-
 Switzerland
-
 Syria
Syria
-
 Taiwan
-
 Tajikistan
-
 Tanzania
-
 Thailand
-
 Trinidad and Tobago
-
 Tunisia
-
 Turkey
-
 UAE
UAE
-
 Uganda
-
 Ukraine
-
 United Kingdom
-
United States
-
 Uruguay
-
 Uzbekistan
-
 Venezuela
-
 Vietnam
-
 Yemen
Yemen
-
 Zambia
-
 Zimbabwe
- Forex
- Crypto
