
-3.33% for Sundial Growers stock — downside pressure continues as buyers struggle to hold support

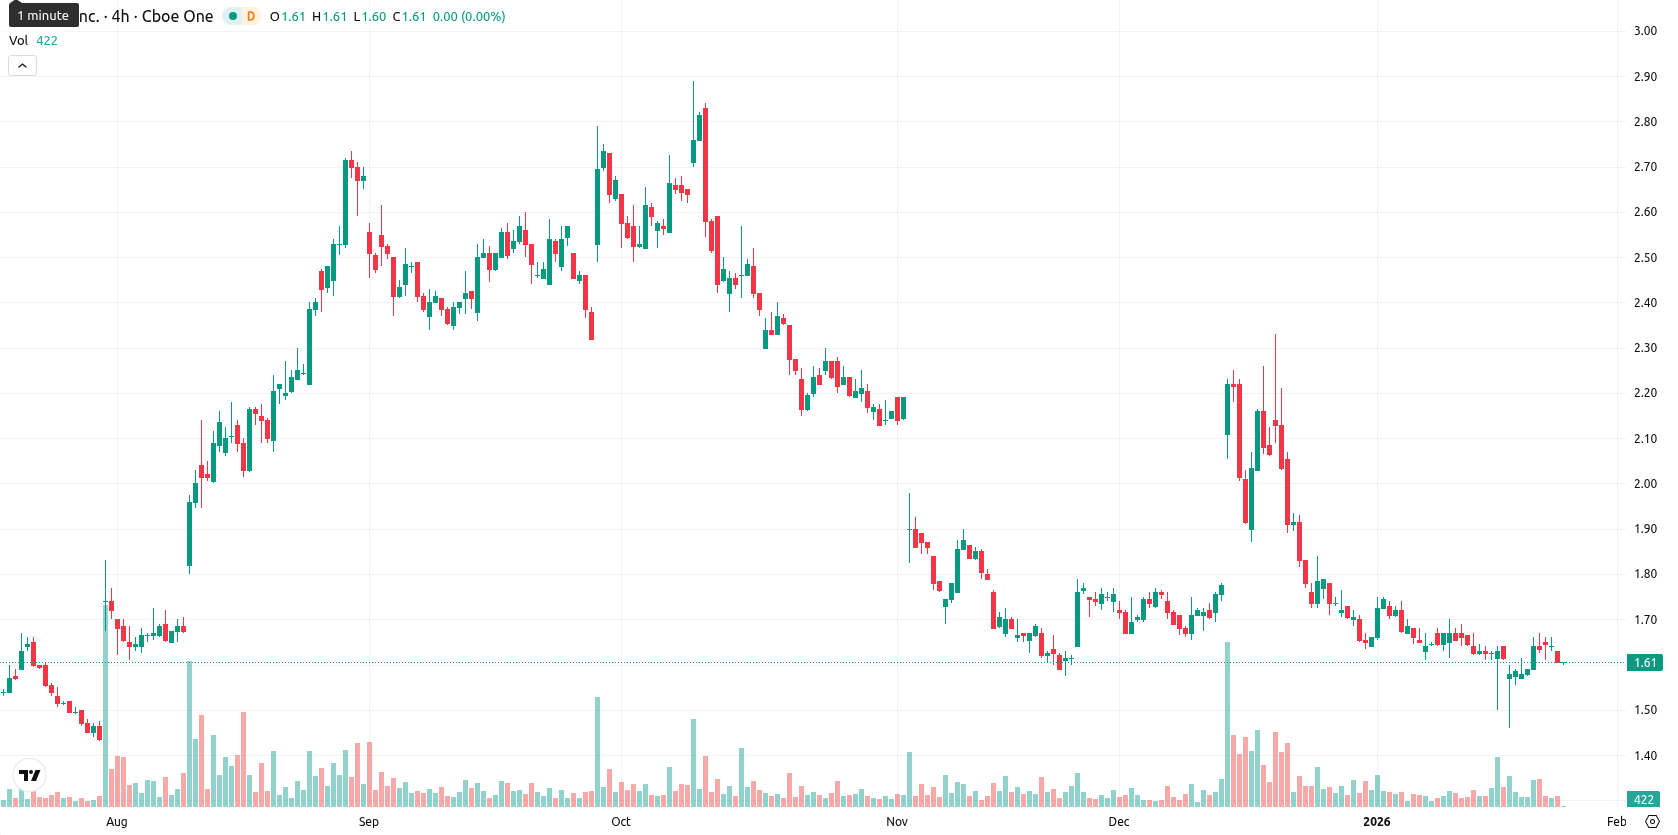
Sundial Growers Inc. (SNDL) is trading at $1.60, below the MA-20 ($1.66), MA-50 ($1.74), and MA-200 ($1.79), signaling sustained bearish pressure across the short, medium, and long-term trends. The nearest dynamic support is seen at the current price zone, with resistance aligning to the Ichimoku Kijun at $1.90.
Highlights
- SNDL is trading at $1.60, below the MA-20 ($1.66), MA-50 ($1.74), and MA-200 ($1.79), indicating persistent bearish pressure across all timeframes.
- Momentum indicators show weakness with strong sell signals on MACD and RSI, while Stochastic RSI is overbought, presenting a notable divergence in oscillator signals.
- Expected trading range for the coming week is $1.52–$1.66, with prevailing downside momentum favoring risk of further weakness toward $1.52 if support fails.
Oscillator divergence and persistent selling as volatility remains muted
Momentum indicators show weakness, with the MACD on a strong sell signal and the ADX remaining neutral at low levels, indicating a lack of clear trend strength. The RSI and Commodity Channel Index are both in sell territory while the Stochastic RSI is overbought, presenting a notable divergence in oscillator signals. Bull/Bear Power shows a strong buy, suggesting buyers are attempting to counter recent selling, yet the daily loss of 3.33% and price dropping from $1.64 on the open (no gap vs. previous close) to near the intraday low reflects prevailing downside momentum. Intraday volatility is mild with price hugging the lower end of today’s range, indicating persistent sell-side pressure after the open.
Downside favored as weekly indicators signal persistent weakness
For the coming week, the expected trading range is adjusted to $1.52 – $1.66 based on current volatility and the price position. Probability of significant price increase is very low (less than 20%), making a continued decline more likely given sell signals across all weekly indicators (MA-50, RSI, MACD, and ADX). The baseline scenario sees SNDL consolidating sideways within this corridor. In a bullish case, a rebound above $1.66 could target the $1.74 – $1.90 resistance band. The bearish scenario, favored by current momentum, risks further weakness toward $1.52 if support fails.
Last time, analysts noted that Sundial Growers Inc. exhibited persistent bearish momentum, with the price trading below key moving averages and oscillators indicating oversold conditions and weak trend strength. Immediate resistance remains near the Ichimoku Kijun level, while narrow support persists around recent lows, suggesting low odds of a rebound and a greater likelihood of continued downside within a defined volatility band.


-
 Afghanistan
-
 Albania
-
 Algeria
-
 Angola
-
 Argentina
-
 Armenia
-
 Australia
-
 Austria
-
 Azerbaijan
-
 Bahamas
-
 Bahrain
-
 Bangladesh
-
 Belarus
-
 Belgium
-
 Bolivia
-
 Botswana
-
 Brazil
-
 Brunei
-
 Bulgaria
-
 Cambodia
-
 Cameroon
-
 Canada
-
 Chile
Chile
-
 China
China
-
 Colombia
-
 Congo
Congo
-
 Costa Rica
-
 Cote d'Ivoire
-
 Croatia
-
 Cuba
Cuba
-
 Cyprus
-
 Czechia
-
 DR Congo
-
 Denmark
-
 Dominican Republic
-
 Ecuador
-
 Egypt
Egypt
-
 El Salvador
-
 Estonia
-
 Eswatini
-
 Ethiopia
-
 Finland
-
 France
-
 Georgia
-
 Germany
-
 Ghana
Ghana
-
 Greece
-
 Haiti
Haiti
-
 Hong Kong
-
 Hungary
-
 India
India
-
 Indonesia
-
 Iran, Islamic republic
-
 Iraq
Iraq
-
 Ireland
-
 Israel
-
 Italy
Italy
-
 Jamaica
-
 Japan
Japan
-
 Jordan
-
 Kazakhstan
-
 Kenya
Kenya
-
 Korea
Korea
-
 Kuwait
-
 Kyrgyzstan
-
 Laos
Laos
-
 Latvia
-
 Lebanon
-
 Lesotho
-
 Libya
Libya
-
 Lithuania
-
 Luxembourg
-
 Madagascar
-
 Malaysia
-
 Malta
Malta
-
 Mauritius
-
 Mexico
-
 Moldova
-
 Mongolia
-
 Montenegro
-
 Morocco
-
 Mozambique
-
 Myanmar
-
 Namibia
-
 Nepal
Nepal
-
 Netherlands
-
 New Zealand
-
 Nigeria
-
 North Macedonia
-
 Norway
-
 Oman
Oman
-
 Pakistan
-
 Palestine
-
 Panama
-
 Papua New Guinea
-
 Paraguay
-
 Peru
Peru
-
 Philippines
-
 Poland
-
 Portugal
-
 Puerto Rico
-
 Qatar
Qatar
-
 Reunion
-
 Romania
-
 Rwanda
-
 Saudi Arabia
-
 Serbia
-
 Singapore
-
 Slovakia
-
 Slovenia
-
 Somalia
-
 South Africa
-
 Spain
Spain
-
 Sri Lanka
-
 Sweden
-
 Switzerland
-
 Syria
Syria
-
 Taiwan
-
 Tajikistan
-
 Tanzania
-
 Thailand
-
 Trinidad and Tobago
-
 Tunisia
-
 Turkey
-
 UAE
UAE
-
 Uganda
-
 Ukraine
-
 United Kingdom
-
United States
-
 Uruguay
-
 Uzbekistan
-
 Venezuela
-
 Vietnam
-
 Yemen
Yemen
-
 Zambia
-
 Zimbabwe
- Forex
- Crypto
