
+3.14% for Sundial Growers stock — sellers keep control despite minor gap up

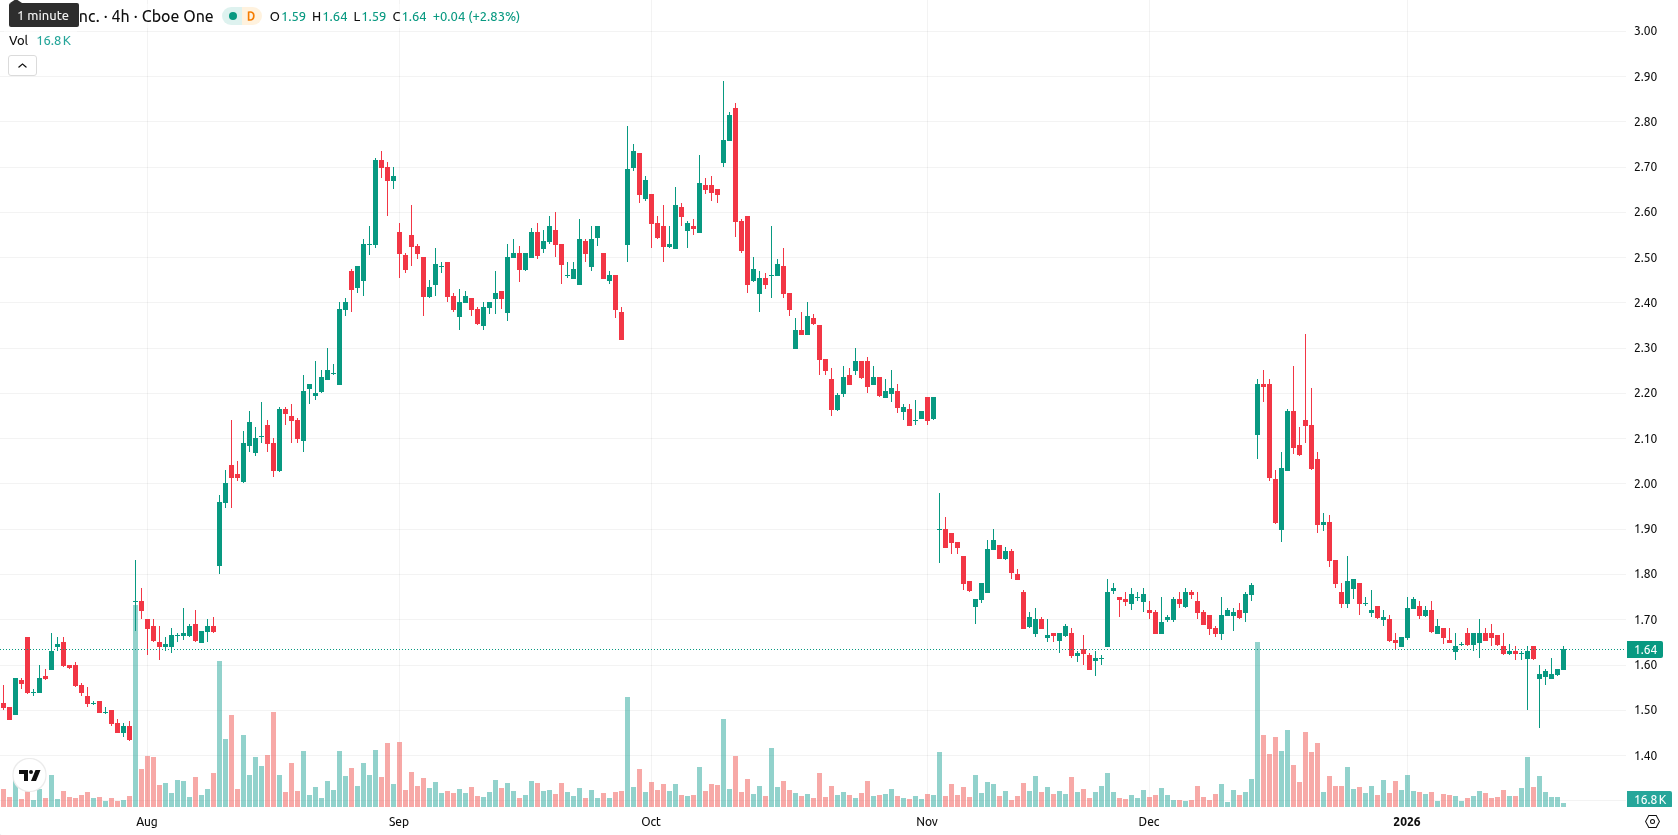
Sundial Growers Inc. (SNDL) is trading at $1.64, below the MA-20 at $1.68, the MA-50 at $1.74, and the MA-200 at $1.78, signaling persistent downward pressure across the short, medium, and long-term trends. The nearest dynamic resistance is the Ichimoku Kijun level at $1.90, with support likely near the lower recent averages and the round $1.60 area.
Highlights
- SNDL trades at $1.64, below key moving averages (MA-20 $1.68, MA-50 $1.74, MA-200 $1.78), reflecting sustained downward pressure across all timeframes.
- MACD and ADX indicators show weak momentum and trend strength, with RSI, CCI, and Stochastic RSI all in deeply oversold territory, signaling persistent bearish sentiment.
- A $1.48 to $1.80 weekly range is projected, with less than 20% chance of a price increase over the next five trading days and downside risk prevailing.
Bearish momentum sustained as oscillators confirm intraday seller dominance
MACD and ADX both indicate weak momentum, with MACD in a clear sell mode and ADX showing lackluster trend strength on the daily timeframe. Several oscillators point to near-term exhaustion, with RSI and CCI both in oversold territory and the Stochastic RSI also confirming a deeply oversold condition. Bull/Bear Power suggests sellers maintain the upper hand intraday. The Awesome Oscillator aligns with this negative trend, reinforcing current bearish momentum. Today’s session saw a small positive gap from the previous close ($1.59) to the open ($1.61), and the current price sits near the top of a narrow daily range ($1.61 — $1.62), highlighting low volatility and an early upward tone.
Low rebound odds as SNDL’s bias favors extended downside
Looking ahead, an adjusted weekly range of $1.48 to $1.80 forms a typical volatility band relative to current levels, accounting for broad indicator signals and historical swings. The probability of a price increase over the next five trading days remains very low (less than 20%), making a further decline more likely. In the baseline scenario, SNDL could remain in a sideways band between $1.48 and $1.80. A bullish scenario would require a breakout above the $1.80 area, driven by a shift in momentum and closing above dynamic resistance, while a bearish outcome becomes likely if SNDL falls below $1.48, potentially triggered by continued seller pressure and weak momentum.
Last time, analysts noted that Sundial Growers Inc. remained under pressure, trading below key moving averages with momentum indicators such as MACD, RSI, and CCI confirming persistent bearish sentiment and oversold conditions. Immediate resistance caps rebound attempts, while weak trend strength and negative momentum suggest the downside scenario is favored within a constrained volatility band.


-
 Afghanistan
-
 Albania
-
 Algeria
-
 Angola
-
 Argentina
-
 Armenia
-
 Australia
-
 Austria
-
 Azerbaijan
-
 Bahamas
-
 Bahrain
-
 Bangladesh
-
 Belarus
-
 Belgium
-
 Bolivia
-
 Botswana
-
 Brazil
-
 Brunei
-
 Bulgaria
-
 Cambodia
-
 Cameroon
-
 Canada
-
 Chile
Chile
-
 China
China
-
 Colombia
-
 Congo
Congo
-
 Costa Rica
-
 Cote d'Ivoire
-
 Croatia
-
 Cuba
Cuba
-
 Cyprus
-
 Czechia
-
 DR Congo
-
 Denmark
-
 Dominican Republic
-
 Ecuador
-
 Egypt
Egypt
-
 El Salvador
-
 Estonia
-
 Eswatini
-
 Ethiopia
-
 Finland
-
 France
-
 Georgia
-
 Germany
-
 Ghana
Ghana
-
 Greece
-
 Haiti
Haiti
-
 Hong Kong
-
 Hungary
-
 India
India
-
 Indonesia
-
 Iran, Islamic republic
-
 Iraq
Iraq
-
 Ireland
-
 Israel
-
 Italy
Italy
-
 Jamaica
-
 Japan
Japan
-
 Jordan
-
 Kazakhstan
-
 Kenya
Kenya
-
 Korea
Korea
-
 Kuwait
-
 Kyrgyzstan
-
 Laos
Laos
-
 Latvia
-
 Lebanon
-
 Lesotho
-
 Libya
Libya
-
 Lithuania
-
 Luxembourg
-
 Madagascar
-
 Malaysia
-
 Malta
Malta
-
 Mauritius
-
 Mexico
-
 Moldova
-
 Mongolia
-
 Montenegro
-
 Morocco
-
 Mozambique
-
 Myanmar
-
 Namibia
-
 Nepal
Nepal
-
 Netherlands
-
 New Zealand
-
 Nigeria
-
 North Macedonia
-
 Norway
-
 Oman
Oman
-
 Pakistan
-
 Palestine
-
 Panama
-
 Papua New Guinea
-
 Paraguay
-
 Peru
Peru
-
 Philippines
-
 Poland
-
 Portugal
-
 Puerto Rico
-
 Qatar
Qatar
-
 Reunion
-
 Romania
-
 Rwanda
-
 Saudi Arabia
-
 Serbia
-
 Singapore
-
 Slovakia
-
 Slovenia
-
 Somalia
-
 South Africa
-
 Spain
Spain
-
 Sri Lanka
-
 Sweden
-
 Switzerland
-
 Syria
Syria
-
 Taiwan
-
 Tajikistan
-
 Tanzania
-
 Thailand
-
 Trinidad and Tobago
-
 Tunisia
-
 Turkey
-
 UAE
UAE
-
 Uganda
-
 Ukraine
-
 United Kingdom
-
United States
-
 Uruguay
-
 Uzbekistan
-
 Venezuela
-
 Vietnam
-
 Yemen
Yemen
-
 Zambia
-
 Zimbabwe
- Forex
- Crypto
