
Sundial Growers stock consolidates as weak momentum persists and sellers remain in control

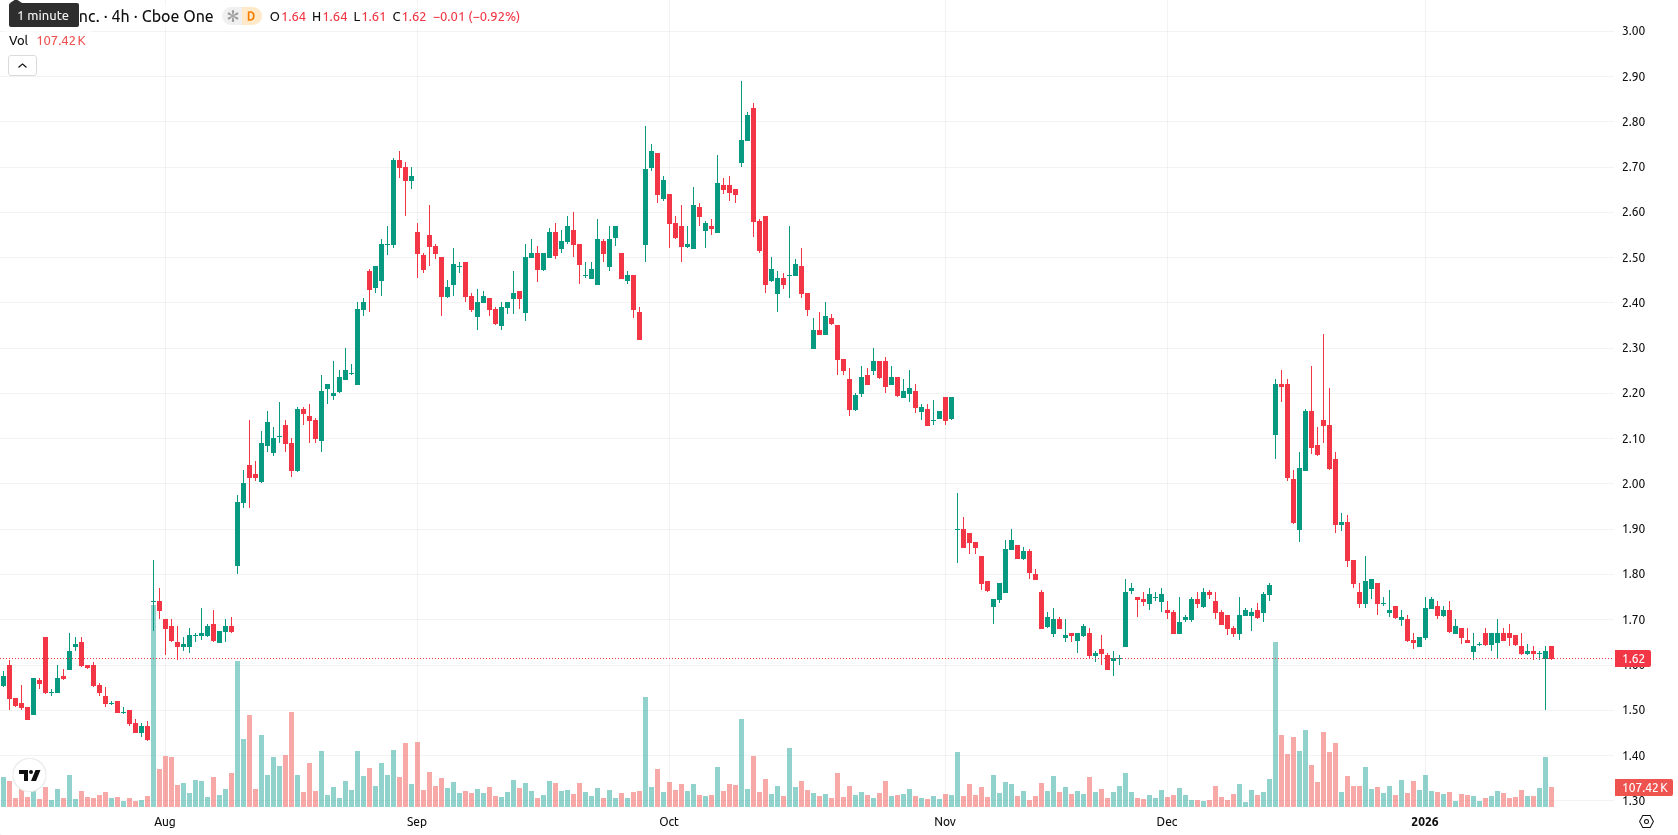
Sundial Growers Inc. (SNDL) is trading at $1.62, below the MA-20 ($1.72), MA-50 ($1.75), and MA-200 ($1.78) daily Moving Averages, indicating prevailing pressure from sellers in the short, medium, and long term.
Highlights
- SNDL trades at $1.62, below the MA-20 ($1.72), MA-50 ($1.75), and MA-200 ($1.78), indicating sustained bearish pressure across timeframes.
- Technical indicators including MACD daily sell, RSI at 40.01, CCI at -106.23, and negative Bull/Bear Power signal oversold conditions and a prevailing bearish trend.
- SNDL is projected to consolidate between $1.46 and $1.78 over the next 5 trading days, with less than 20% probability of a price increase.
Bearish momentum persists as oversold signals and resistance cap rebound
The nearest dynamic resistance is at the Ichimoku Kijun level of $1.93, while immediate dynamic support is around the daily low within today’s trading range. Momentum readings are weak, with the MACD signaling a daily sell and the ADX remaining neutral, suggesting no clear trend strength. The RSI is at 40.01 and the CCI at -106.23, both reflecting oversold conditions, while the Stochastic RSI on D1 and W1 also signals "Oversold." Bull/Bear Power is negative at -0.03, indicating sellers dominate intraday momentum, and the Awesome Oscillator also supports the prevailing bearish trend. There was a minor gap down at the open (yesterday's close $1.62, today’s open $1.53), with the price now at the mid-point between today’s high ($1.64) and low ($1.52), suggesting moderate intraday volatility and a tone of sideways consolidation despite the early pressure.
Downside scenario favored as volatility band constrains recovery
For the next 5 trading days, SNDL is expected to trade between $1.46 and $1.78, keeping within a typical volatility band relative to current levels. The probability of a price increase is very low (less than 20%), so a further decline is more likely given all major weekly and daily indicators point to bearish momentum. The baseline scenario is sideways movement within this corridor unless momentum shifts. A bullish scenario would require a break above $1.78 resistance, while renewed selling below $1.46 could trigger a deeper downturn.
Previously it was reported that Sundial Growers Inc. is trading below all major moving averages, with price action underscoring sustained seller dominance and no immediate dynamic support. Technical indicators including the MACD, RSI, CCI, and oscillators confirm bearish momentum and oversold conditions, while the stock consolidates within a tight range, facing resistance near $1.98 and ongoing downside risk if support near $1.54 fails.


-
 Afghanistan
-
 Albania
-
 Algeria
-
 Angola
-
 Argentina
-
 Armenia
-
 Australia
-
 Austria
-
 Azerbaijan
-
 Bahamas
-
 Bahrain
-
 Bangladesh
-
 Belarus
-
 Belgium
-
 Bolivia
-
 Botswana
-
 Brazil
-
 Brunei
-
 Bulgaria
-
 Cambodia
-
 Cameroon
-
 Canada
-
 Chile
Chile
-
 China
China
-
 Colombia
-
 Congo
Congo
-
 Costa Rica
-
 Cote d'Ivoire
-
 Croatia
-
 Cuba
Cuba
-
 Cyprus
-
 Czechia
-
 DR Congo
-
 Denmark
-
 Dominican Republic
-
 Ecuador
-
 Egypt
Egypt
-
 El Salvador
-
 Estonia
-
 Eswatini
-
 Ethiopia
-
 Finland
-
 France
-
 Georgia
-
 Germany
-
 Ghana
Ghana
-
 Greece
-
 Haiti
Haiti
-
 Hong Kong
-
 Hungary
-
 India
India
-
 Indonesia
-
 Iran, Islamic republic
-
 Iraq
Iraq
-
 Ireland
-
 Israel
-
 Italy
Italy
-
 Jamaica
-
 Japan
Japan
-
 Jordan
-
 Kazakhstan
-
 Kenya
Kenya
-
 Korea
Korea
-
 Kuwait
-
 Kyrgyzstan
-
 Laos
Laos
-
 Latvia
-
 Lebanon
-
 Lesotho
-
 Libya
Libya
-
 Lithuania
-
 Luxembourg
-
 Madagascar
-
 Malaysia
-
 Malta
Malta
-
 Mauritius
-
 Mexico
-
 Moldova
-
 Mongolia
-
 Montenegro
-
 Morocco
-
 Mozambique
-
 Myanmar
-
 Namibia
-
 Nepal
Nepal
-
 Netherlands
-
 New Zealand
-
 Nigeria
-
 North Macedonia
-
 Norway
-
 Oman
Oman
-
 Pakistan
-
 Palestine
-
 Panama
-
 Papua New Guinea
-
 Paraguay
-
 Peru
Peru
-
 Philippines
-
 Poland
-
 Portugal
-
 Puerto Rico
-
 Qatar
Qatar
-
 Reunion
-
 Romania
-
 Rwanda
-
 Saudi Arabia
-
 Serbia
-
 Singapore
-
 Slovakia
-
 Slovenia
-
 Somalia
-
 South Africa
-
 Spain
Spain
-
 Sri Lanka
-
 Sweden
-
 Switzerland
-
 Syria
Syria
-
 Taiwan
-
 Tajikistan
-
 Tanzania
-
 Thailand
-
 Trinidad and Tobago
-
 Tunisia
-
 Turkey
-
 UAE
UAE
-
 Uganda
-
 Ukraine
-
 United Kingdom
-
United States
-
 Uruguay
-
 Uzbekistan
-
 Venezuela
-
 Vietnam
-
 Yemen
Yemen
-
 Zambia
-
 Zimbabwe
- Forex
- Crypto
