
Sundial Growers stock: absence of support signals leads to 1.23% drop

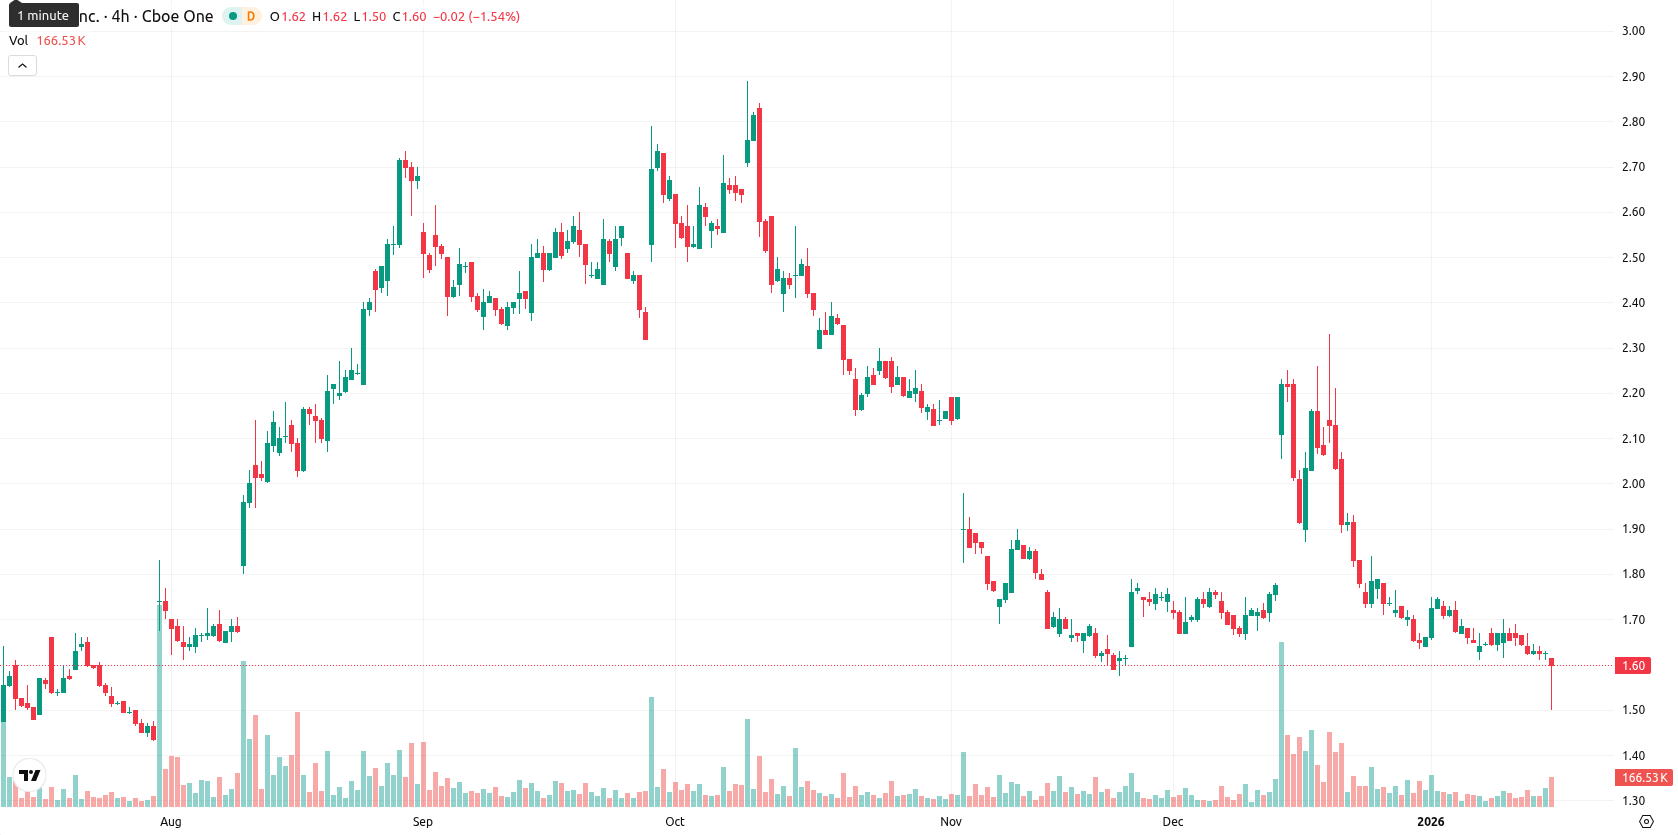
Sundial Growers Inc. (SNDL) is trading at $1.60, marking a 1.23% decline on the day and currently sitting below the MA-20 ($1.74), MA-50 ($1.76), and MA-200 ($1.78), underscoring sustained seller dominance across all key moving averages.
Highlights
- SNDL trades at $1.60, below MA-20 ($1.74), MA-50 ($1.76), and MA-200 ($1.78), confirming seller dominance across all timeframes.
- Momentum indicators including daily MACD, ADX, RSI, and the Awesome Oscillator are bearish, with Stochastic RSI showing the stock is currently oversold.
- Expected range for SNDL next week is $1.54 to $1.66, with less than 20% probability of a price increase and a higher likelihood of further downside.
Bearish momentum intensifies as resistance holds and trend weakens
The nearest resistance for SNDL is shown by the Ichimoku Kijun level at $1.98, with no immediate dynamic support since all major moving averages are above the current price. Momentum indicators, including a firmly negative daily MACD and a subdued ADX on the daily chart, highlight the lack of a clear trend. The RSI and CCI both signal selling pressure, while the Stochastic RSI points to an oversold state on daily and shorter intervals. Bearish readings on Bull/Bear Power and the Awesome Oscillator reinforce the downward bias, as price action trades near the lower end of today's limited intraday range ($1.61–$1.64), reflecting low volatility since the open.
Consolidation outlook persists as reversal risk remains subdued
In the short term, SNDL is expected to trade within a $1.54 to $1.66 volatility band relative to current levels over the next week. Technical signals suggest a low probability (under 20%) for a bullish reversal, with a sideways consolidation as the baseline expectation. Breaking above immediate resistance may send the price toward $1.66, while a move below $1.54 would indicate further downside risk driven by prevailing bearish momentum.
Last time, analysts noted that Sundial Growers Inc. is trading below key moving averages, with persistent bearish momentum confirmed by weak MACD and oversold RSI and Stochastic indicators, while volatility remains low and intraday sellers remain dominant. The price is consolidating near recent lows, facing resistance at $1.98, with ongoing downside risks and a high likelihood of further decline or sideways movement in the near term.


-
 Afghanistan
-
 Albania
-
 Algeria
-
 Angola
-
 Argentina
-
 Armenia
-
 Australia
-
 Austria
-
 Azerbaijan
-
 Bahamas
-
 Bahrain
-
 Bangladesh
-
 Belarus
-
 Belgium
-
 Bolivia
-
 Botswana
-
 Brazil
-
 Brunei
-
 Bulgaria
-
 Cambodia
-
 Cameroon
-
 Canada
-
 Chile
Chile
-
 China
China
-
 Colombia
-
 Congo
Congo
-
 Costa Rica
-
 Cote d'Ivoire
-
 Croatia
-
 Cuba
Cuba
-
 Cyprus
-
 Czechia
-
 DR Congo
-
 Denmark
-
 Dominican Republic
-
 Ecuador
-
 Egypt
Egypt
-
 El Salvador
-
 Estonia
-
 Eswatini
-
 Ethiopia
-
 Finland
-
 France
-
 Georgia
-
 Germany
-
 Ghana
Ghana
-
 Greece
-
 Haiti
Haiti
-
 Hong Kong
-
 Hungary
-
 India
India
-
 Indonesia
-
 Iran, Islamic republic
-
 Iraq
Iraq
-
 Ireland
-
 Israel
-
 Italy
Italy
-
 Jamaica
-
 Japan
Japan
-
 Jordan
-
 Kazakhstan
-
 Kenya
Kenya
-
 Korea
Korea
-
 Kuwait
-
 Kyrgyzstan
-
 Laos
Laos
-
 Latvia
-
 Lebanon
-
 Lesotho
-
 Libya
Libya
-
 Lithuania
-
 Luxembourg
-
 Madagascar
-
 Malaysia
-
 Malta
Malta
-
 Mauritius
-
 Mexico
-
 Moldova
-
 Mongolia
-
 Montenegro
-
 Morocco
-
 Mozambique
-
 Myanmar
-
 Namibia
-
 Nepal
Nepal
-
 Netherlands
-
 New Zealand
-
 Nigeria
-
 North Macedonia
-
 Norway
-
 Oman
Oman
-
 Pakistan
-
 Palestine
-
 Panama
-
 Papua New Guinea
-
 Paraguay
-
 Peru
Peru
-
 Philippines
-
 Poland
-
 Portugal
-
 Puerto Rico
-
 Qatar
Qatar
-
 Reunion
-
 Romania
-
 Rwanda
-
 Saudi Arabia
-
 Serbia
-
 Singapore
-
 Slovakia
-
 Slovenia
-
 Somalia
-
 South Africa
-
 Spain
Spain
-
 Sri Lanka
-
 Sweden
-
 Switzerland
-
 Syria
Syria
-
 Taiwan
-
 Tajikistan
-
 Tanzania
-
 Thailand
-
 Trinidad and Tobago
-
 Tunisia
-
 Turkey
-
 UAE
UAE
-
 Uganda
-
 Ukraine
-
 United Kingdom
-
United States
-
 Uruguay
-
 Uzbekistan
-
 Venezuela
-
 Vietnam
-
 Yemen
Yemen
-
 Zambia
-
 Zimbabwe
- Forex
- Crypto
