
Affirm stock slips as selling pressure builds despite new Intuit and Expedia deals

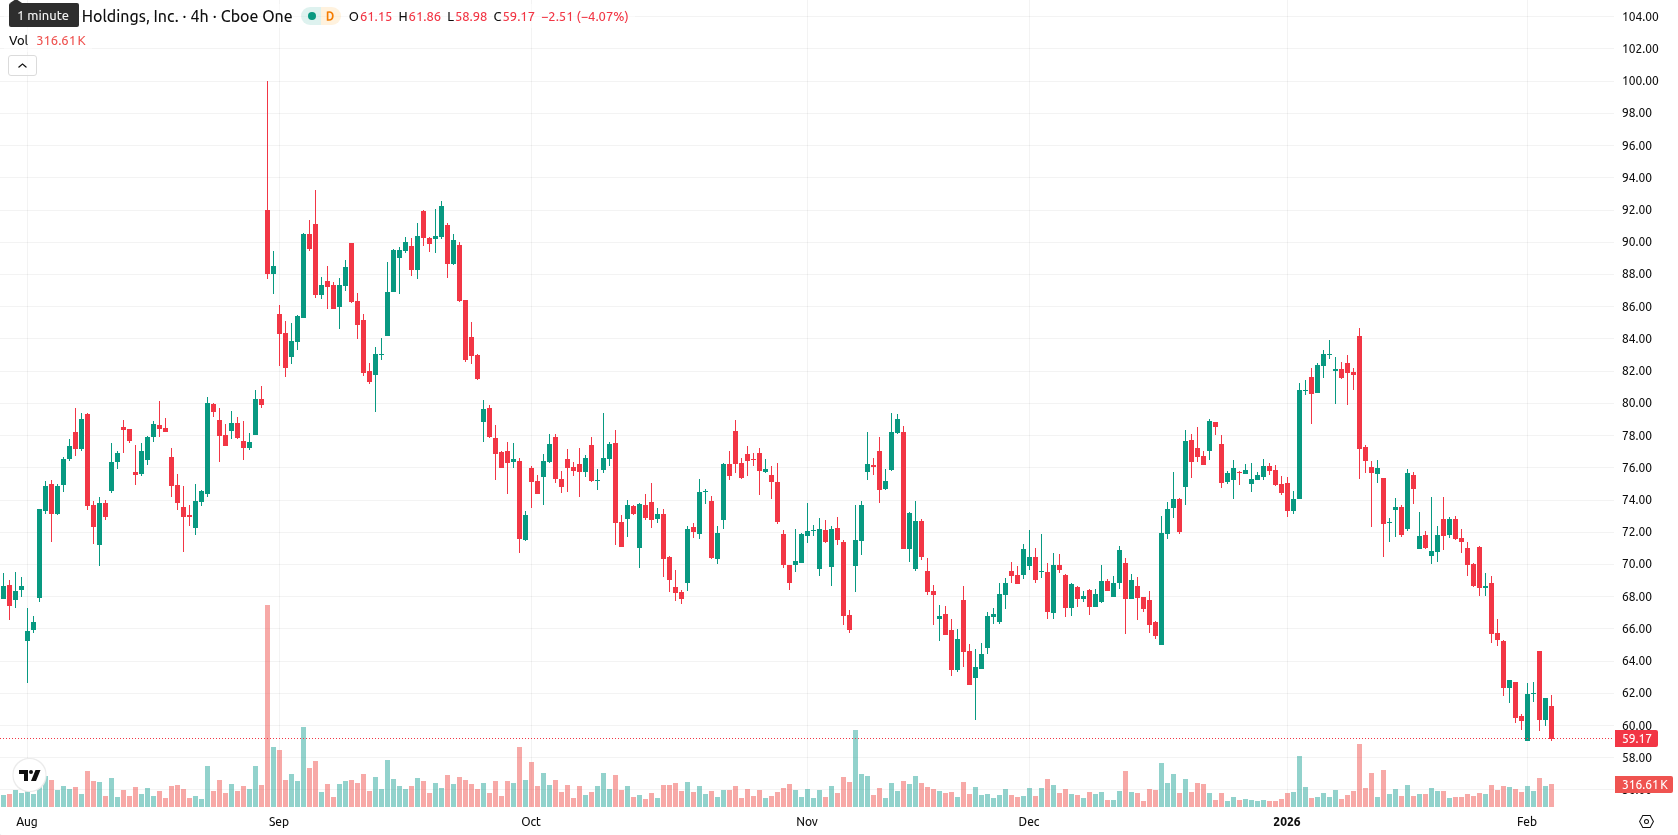
Affirm Holdings, Inc. (AFRM) is trading at $59.24, down $2.42 or 3.93% on the day. The price is positioned well below the Moving Average-20 ($71.85), MA-50 ($71.52), and MA-200 ($68.96), signaling ongoing pressure from sellers in the short, medium, and long term.
Highlights
- Affirm secured major partnerships, integrating buy now, pay later services with Intuit's QuickBooks Payments and becoming Expedia Group's exclusive U.S. provider for lodging and packages.
- Institutional investor AGF Management Ltd. acquired 142,121 Affirm shares worth approximately $10.39 million, anticipating the upcoming Q2 fiscal 2026 earnings report.
- AFRM trades at $59.24, well below MA-20 ($71.85) and facing a high probability (>80%) of further decline towards the $56.50–$62.00 range amid strong bearish momentum.
Expanded partnerships and investor demand drive optimistic sentiment
Affirm has announced expanded partnerships with Intuit, integrating its services into QuickBooks Payments, and with Expedia Group, making Affirm the exclusive provider of buy now, pay later options for lodging and packages in the U.S. The company has also strengthened collaborations in Canada with Shopify and Adyen. Additionally, institutional investor AGF Management Ltd. acquired 142,121 shares of Affirm, valued at approximately $10.39 million, in the third quarter, with expectations rising ahead of the upcoming Q2 fiscal 2026 earnings report.
Oversold signals heighten as negative momentum and weak trend persist
Bearish momentum dominates the technical setup, with AFRM trading well below its key moving averages and the nearest resistance marked by the Ichimoku Kijun at $71.83. MACD signals persistent negative momentum, and the weak ADX reflects limited trend strength. Oscillators, including RSI (32.69), Stochastic RSI (19.20), and CCI (-129.05), indicate oversold conditions, while Bull/Bear Power is deeply negative, pointing to strong intraday seller control. The price remains anchored near the intraday low of $59.26 within a volatile daily range of $59.26 – $61.84.
Bearish bias dominates as volatility bands signal further downside risk
For the coming week, the typical volatility band is estimated at $56.50 to $62.00, based on current price action and recent swings. Bearish continuation is highly probable, with an over 80% chance of further declines within this range. Sideways trading near current levels is the baseline expectation, while a break above $62.00 would suggest a bullish reversal and a dip below $56.50 could trigger further selling pressure.
Last time, analysts noted that Affirm Holdings, Inc. remained under persistent downward pressure, with the stock trading below all key moving averages and oversold readings dominating indicators such as the RSI, MACD, and CCI. Despite a brief intraday rebound and ongoing volatility, technicals continue to signal weak momentum, with support near $60 and resistance at $72, suggesting a sideways to lower near-term bias unless buyers show sustained strength above resistance.


Latest Affirm News


-
 Afghanistan
-
 Albania
-
 Algeria
-
 Angola
-
 Argentina
-
 Armenia
-
 Australia
-
 Austria
-
 Azerbaijan
-
 Bahamas
-
 Bahrain
-
 Bangladesh
-
 Belarus
-
 Belgium
-
 Bolivia
-
 Botswana
-
 Brazil
-
 Brunei
-
 Bulgaria
-
 Cambodia
-
 Cameroon
-
 Canada
-
 Chile
Chile
-
 China
China
-
 Colombia
-
 Congo
Congo
-
 Costa Rica
-
 Cote d'Ivoire
-
 Croatia
-
 Cuba
Cuba
-
 Cyprus
-
 Czechia
-
 DR Congo
-
 Denmark
-
 Dominican Republic
-
 Ecuador
-
 Egypt
Egypt
-
 El Salvador
-
 Estonia
-
 Eswatini
-
 Ethiopia
-
 Finland
-
 France
-
 Georgia
-
 Germany
-
 Ghana
Ghana
-
 Greece
-
 Haiti
Haiti
-
 Hong Kong
-
 Hungary
-
 India
India
-
 Indonesia
-
 Iran, Islamic republic
-
 Iraq
Iraq
-
 Ireland
-
 Israel
-
 Italy
Italy
-
 Jamaica
-
 Japan
Japan
-
 Jordan
-
 Kazakhstan
-
 Kenya
Kenya
-
 Korea
Korea
-
 Kuwait
-
 Kyrgyzstan
-
 Laos
Laos
-
 Latvia
-
 Lebanon
-
 Lesotho
-
 Libya
Libya
-
 Lithuania
-
 Luxembourg
-
 Madagascar
-
 Malaysia
-
 Malta
Malta
-
 Mauritius
-
 Mexico
-
 Moldova
-
 Mongolia
-
 Montenegro
-
 Morocco
-
 Mozambique
-
 Myanmar
-
 Namibia
-
 Nepal
Nepal
-
 Netherlands
-
 New Zealand
-
 Nigeria
-
 North Macedonia
-
 Norway
-
 Oman
Oman
-
 Pakistan
-
 Palestine
-
 Panama
-
 Papua New Guinea
-
 Paraguay
-
 Peru
Peru
-
 Philippines
-
 Poland
-
 Portugal
-
 Puerto Rico
-
 Qatar
Qatar
-
 Reunion
-
 Romania
-
 Rwanda
-
 Saudi Arabia
-
 Serbia
-
 Singapore
-
 Slovakia
-
 Slovenia
-
 Somalia
-
 South Africa
-
 Spain
Spain
-
 Sri Lanka
-
 Sweden
-
 Switzerland
-
 Syria
Syria
-
 Taiwan
-
 Tajikistan
-
 Tanzania
-
 Thailand
-
 Trinidad and Tobago
-
 Tunisia
-
 Turkey
-
 UAE
UAE
-
 Uganda
-
 Ukraine
-
 United Kingdom
-
United States
-
 Uruguay
-
 Uzbekistan
-
 Venezuela
-
 Vietnam
-
 Yemen
Yemen
-
 Zambia
-
 Zimbabwe
- Forex
- Crypto
